

Configuring Prometheus metrics monitoring for KIE Server
You can configure your KIE Server instances to use Prometheus to collect and store metrics related to your business asset activity in jBPM. For the list of available metrics that KIE Server exposes with Prometheus, see the KIE Server Prometheus Extension page in GitHub. Prerequisites- KIE Server is installed.
- You have
kie-serveruser role access to KIE Server. - Prometheus is installed. For information about downloading and using Prometheus, see the Prometheus documentation page.
-
In your KIE Server instance, set the
org.kie.prometheus.server.ext.disabledsystem property tofalseto enable the Prometheus extension. You can define this property when you start KIE Server or in thestandalone.xmlorstandalone-full.xmlfile of the jBPM distribution. -
If you are running jBPM on Spring Boot, configure the required key in the
application.propertiessystem property:Spring Boot application.properties key for jBPM and Prometheus -
In the
prometheus.yamlfile of your Prometheus distribution, add the following settings in thescrape_configssection to configure Prometheus to scrape metrics from KIE Server:Scrape configurations in prometheus.yaml fileReplace the values according to your KIE Server location and settings.Scrape configurations in prometheus.yaml file for Spring Boot (if applicable) -
Start the KIE Server instance.
After you start the configured KIE Server instance, Prometheus begins collecting metrics and KIE Server publishes the metrics to the REST API endpoint
http://HOST:PORT/SERVER/services/rest/metrics(or on Spring Boot, tohttp://HOST:PORT/rest/metrics). -
In a REST client or curl utility, send a REST API request with the following components to verify that KIE Server is publishing the metrics:
For REST client:
- Authentication: Enter the user name and password of the KIE Server user with the
kie-serverrole. - HTTP Headers: Set the following header:
Accept:application/json
- HTTP method: Set to
GET. - URL: Enter the KIE Server REST API base URL and metrics endpoint, such as
http://localhost:8080/kie-server/services/rest/metrics(or on Spring Boot,http://localhost:8080/rest/metrics).
-u: Enter the user name and password of the KIE Server user with thekie-serverrole.-H: Set the following header:accept:application/json
-X: Set toGET.- URL: Enter the KIE Server REST API base URL and metrics endpoint, such as
http://localhost:8080/kie-server/services/rest/metrics(or on Spring Boot,http://localhost:8080/rest/metrics).
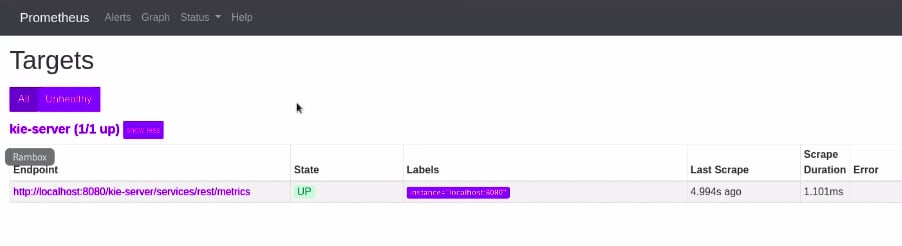
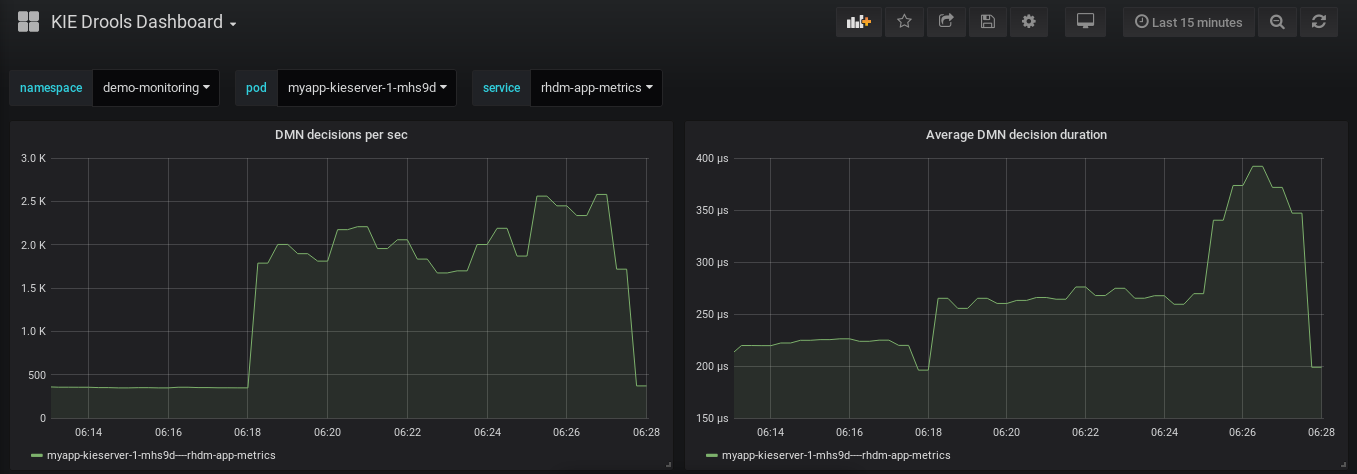
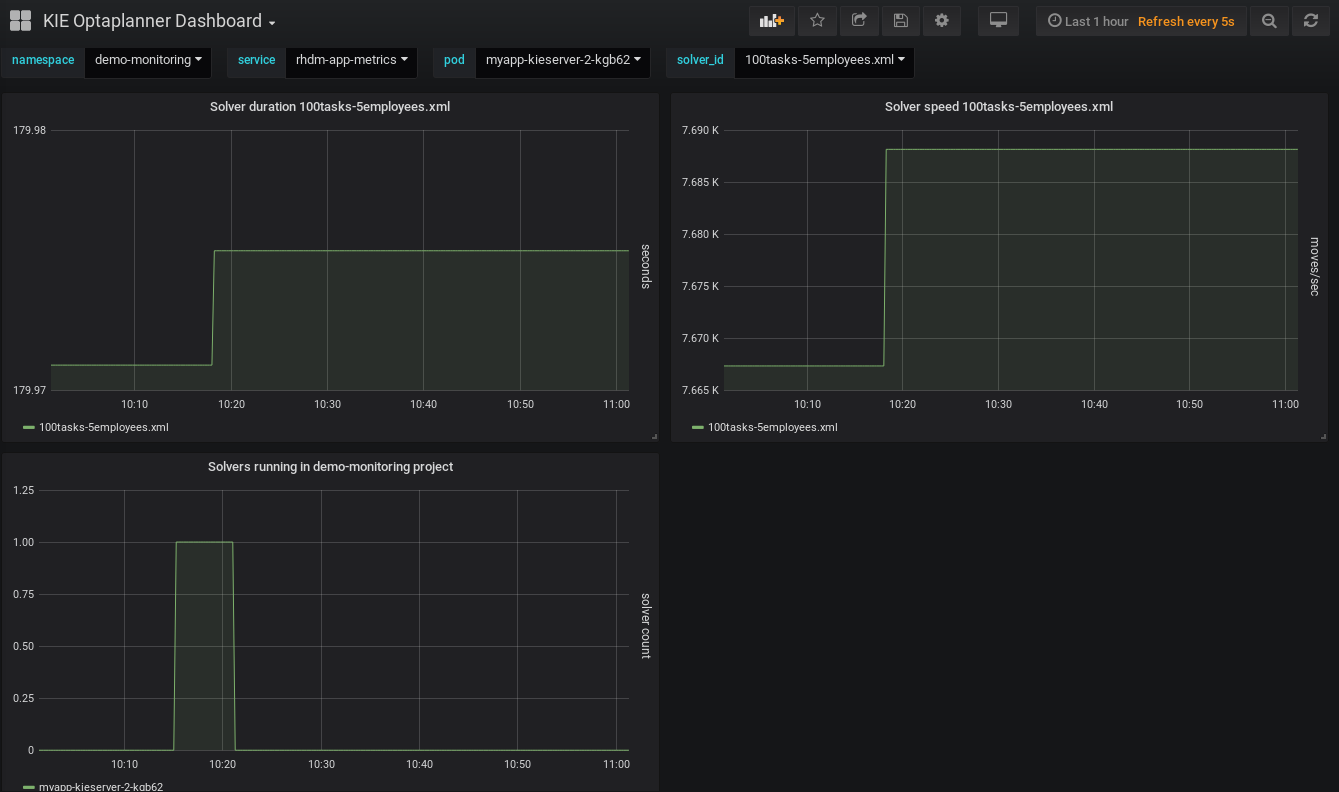
Example curl command for jBPM on WildflyExample curl command for jBPM on Spring BootIf the metrics are not available in KIE Server, review and verify the KIE Server and Prometheus configurations described in this section. You can also interact with your collected metrics in the Prometheus expression browser atExample server responsehttp://HOST:PORT/graph, or integrate your Prometheus data source with a data-graphing tool such as Grafana: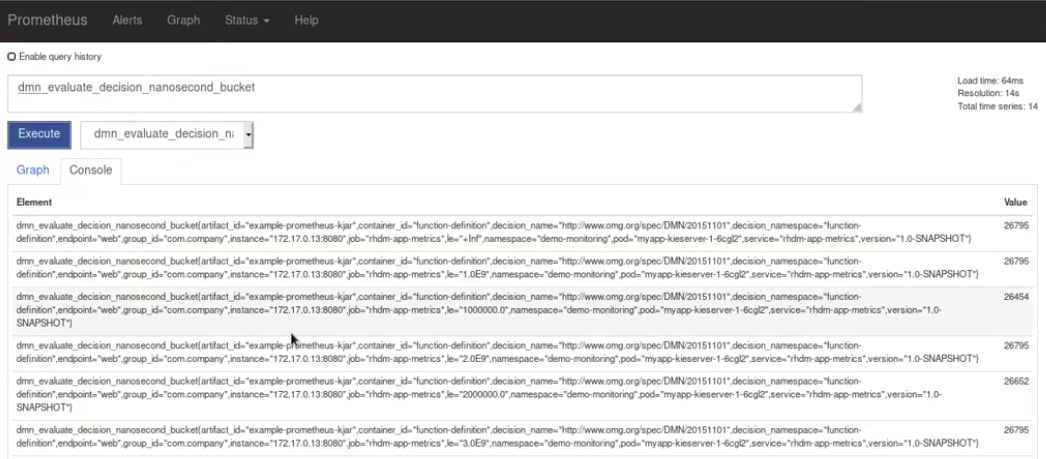
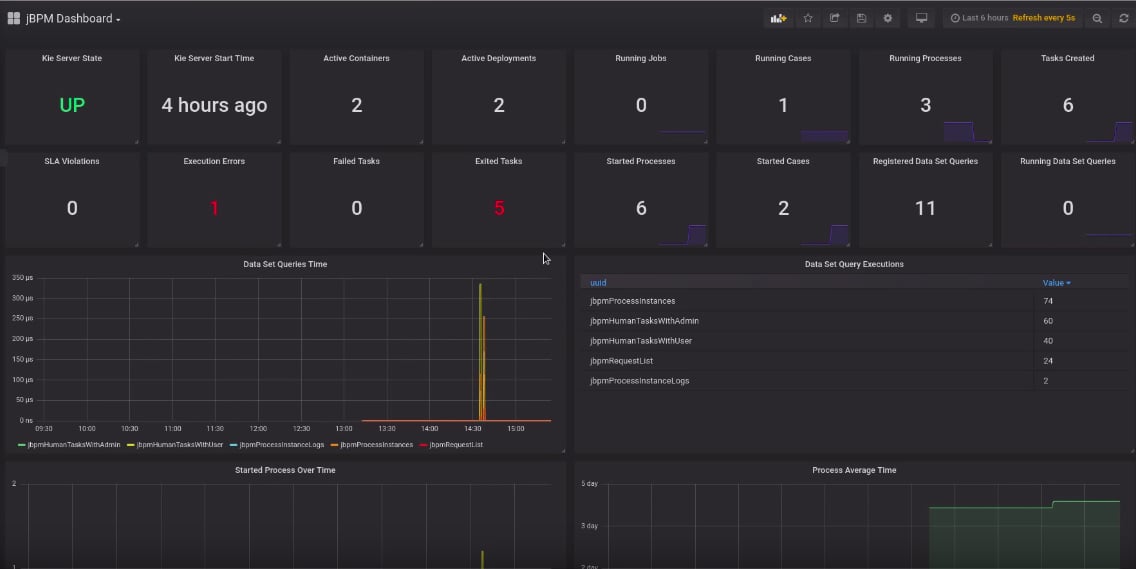
- Authentication: Enter the user name and password of the KIE Server user with the
Extending Prometheus metrics monitoring in KIE Server with custom metrics
After you configure your KIE Server instance to use Prometheus metrics monitoring, you can extend the Prometheus functionality in KIE Server to use custom metrics according to your business needs. Prometheus then collects and stores your custom metrics along with the default metrics that KIE Server exposes with Prometheus. As an example, this procedure defines custom Decision Model and Notation (DMN) metrics to be collected and stored by Prometheus. Prerequisites- Prometheus metrics monitoring is configured for your KIE Server instance. For information about Prometheus configuration with KIE Server on-premise, see Configuring Prometheus metrics monitoring for KIE Server.
-
Create an empty Maven project and define the following packaging type and dependencies in the
pom.xmlfile for the project:Example pom.xml file in the sample project -
Implement the relevant listener from the
org.kie.server.services.prometheus.PrometheusMetricsProviderinterface as part of the custom listener class that defines your custom Prometheus metrics, as shown in the following example:TheSample implementation of the DMNRuntimeEventListener listener in a custom listener classPrometheusMetricsProviderinterface contains the required listeners for collecting Prometheus metrics. The interface is incorporated by thekie-server-services-prometheusdependency that you declared in your projectpom.xmlfile. In this example, theExampleCustomPrometheusMetricListenerclass implements theDMNRuntimeEventListenerlistener (from thePrometheusMetricsProviderinterface) and defines the custom DMN metrics to be collected and stored by Prometheus. -
Implement the
PrometheusMetricsProviderinterface as part of a custom metrics provider class that associates your custom listener with thePrometheusMetricsProviderinterface, as shown in the following example:In this example, theSample implementation of the PrometheusMetricsProvider interface in a custom metrics provider classMyPrometheusMetricsProviderclass implements thePrometheusMetricsProviderinterface and includes your customExampleCustomPrometheusMetricListenerlistener class. -
To make the new metrics provider discoverable for KIE Server, create a
META-INF/services/org.kie.server.services.prometheus.PrometheusMetricsProviderfile in your Maven project and add the fully qualified class name of thePrometheusMetricsProviderimplementation class within the file. For this example, the file contains the single lineorg.kie.server.ext.prometheus.MyPrometheusMetricsProvider. -
Build your project and copy the resulting JAR file into the
~/kie-server.war/WEB-INF/libdirectory of your project. -
Start the KIE Server and deploy the built project to the running KIE Server. You can deploy the project using the Business Central interface or the KIE Server REST API (a
PUTrequest tohttp://SERVER:PORT/kie-server/services/rest/server/containers/{containerId}). After your project is deployed on a running KIE Server, Prometheus begins collecting metrics and KIE Server publishes the metrics to the REST API endpointhttp://HOST:PORT/SERVER/services/rest/metrics(or on Spring Boot, tohttp://HOST:PORT/rest/metrics).