

Executions
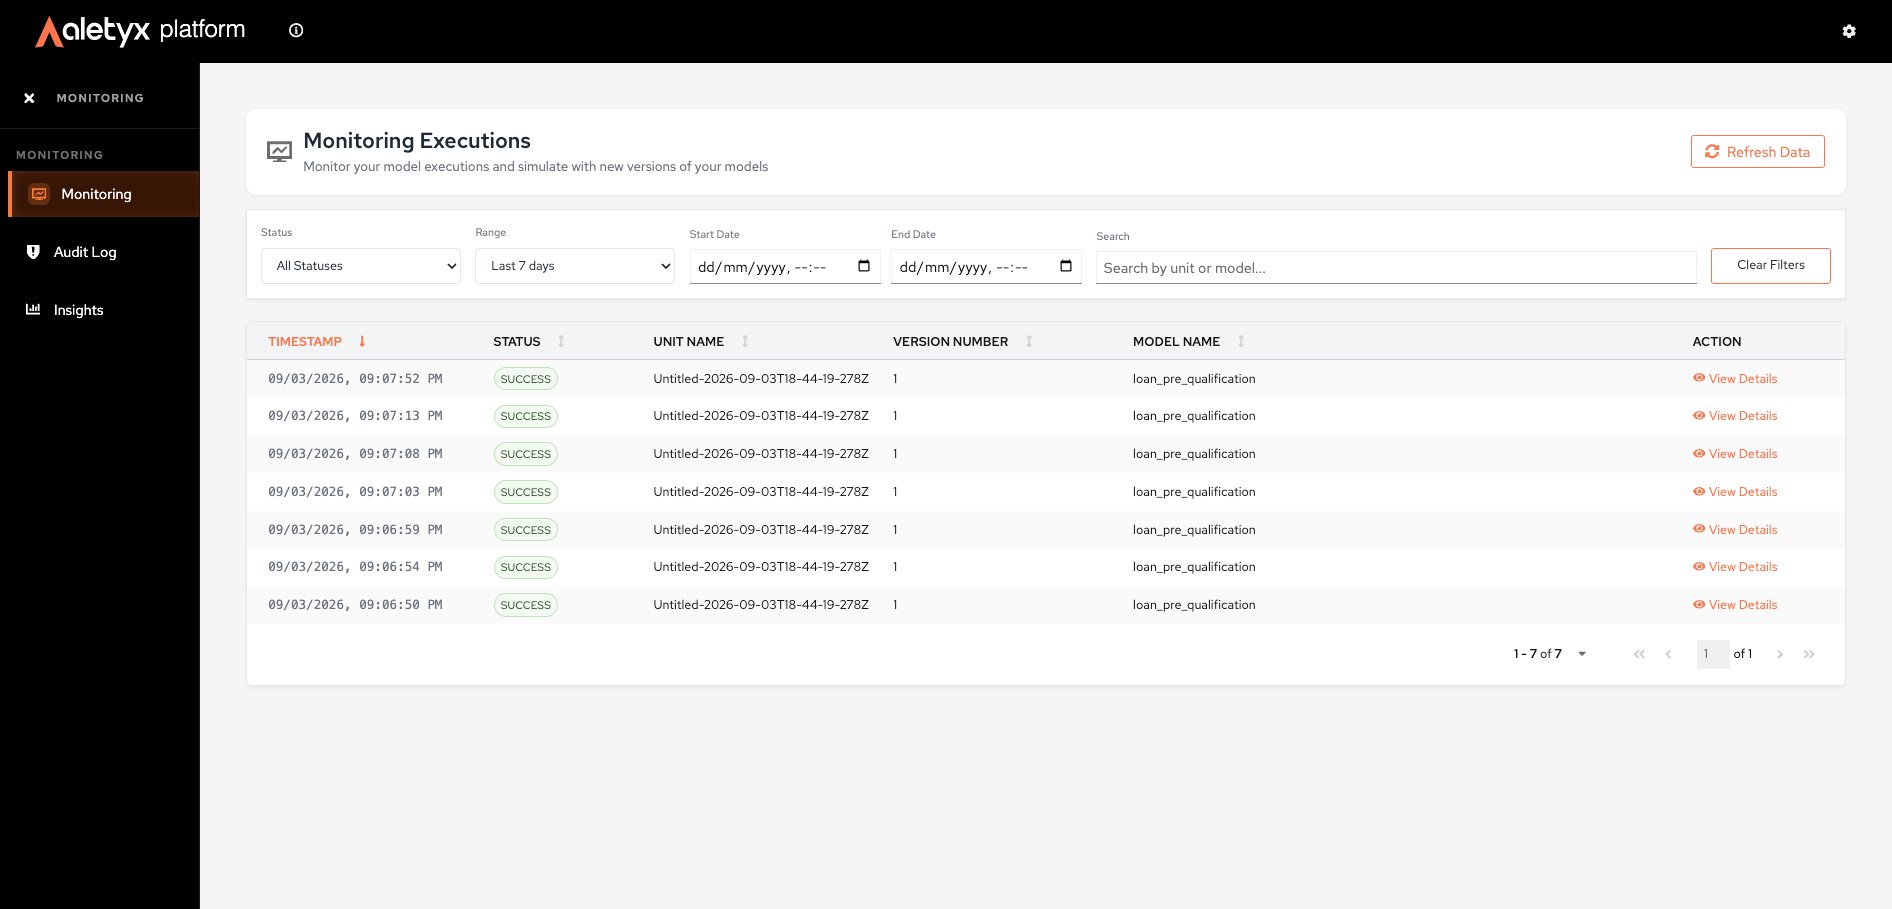
Executions vs. Execute Decisions historyThese are the persisted server-side execution records — they survive reloads and are visible to everyone with Management access. The History tab inside Execute Decisions is your local replay buffer for the current session.
How to view and filter executions
Browse all model executions and narrow the list. Steps:- Open Monitoring → Monitoring (executions list).
- Use Search by unit or model…, the Status filter, and the Range (or custom Start/End Date) filter.
- Sort via column headers; Clear Filters to reset; Refresh Data to reload.
How to view execution details
Inspect one execution’s inputs, outputs, and metadata. Steps:- In the executions list, click View Details (or the row).
- Review the Execution Detail tab; switch input/output between Form View and JSON.
- (Optional) Click the copy icon next to the execution ID to copy a shareable link to this execution.
How to run a simulation against another model version
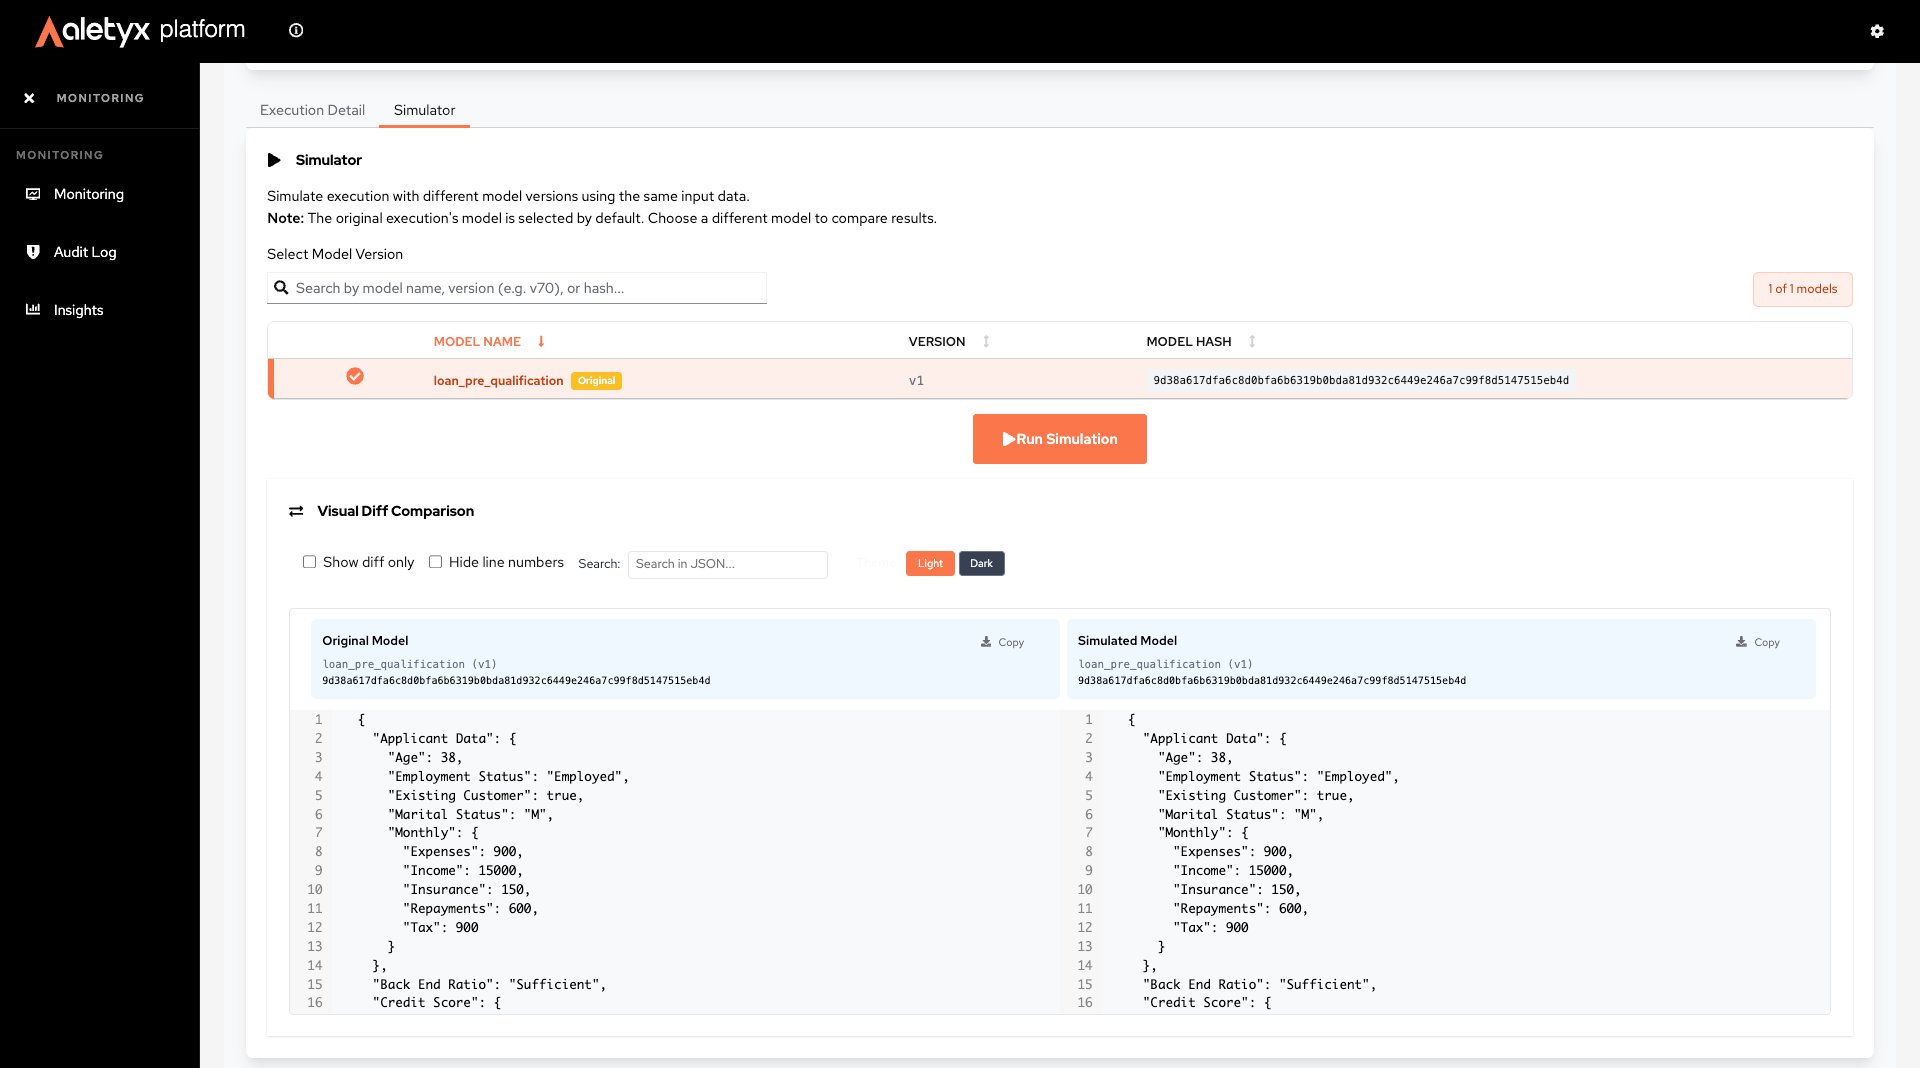
Re-run a past execution’s inputs against a different model version and compare — the fastest way to answer “would this case behave differently on the new version?” Prerequisites: Viewing an execution detail. Steps:- Open the Simulator tab.
- Search/select a model version (by name, version, or hash).
- Click Run Simulation.
-
Use the diff controls (Show diff only, search, theme) to compare outputs.
Audit Log
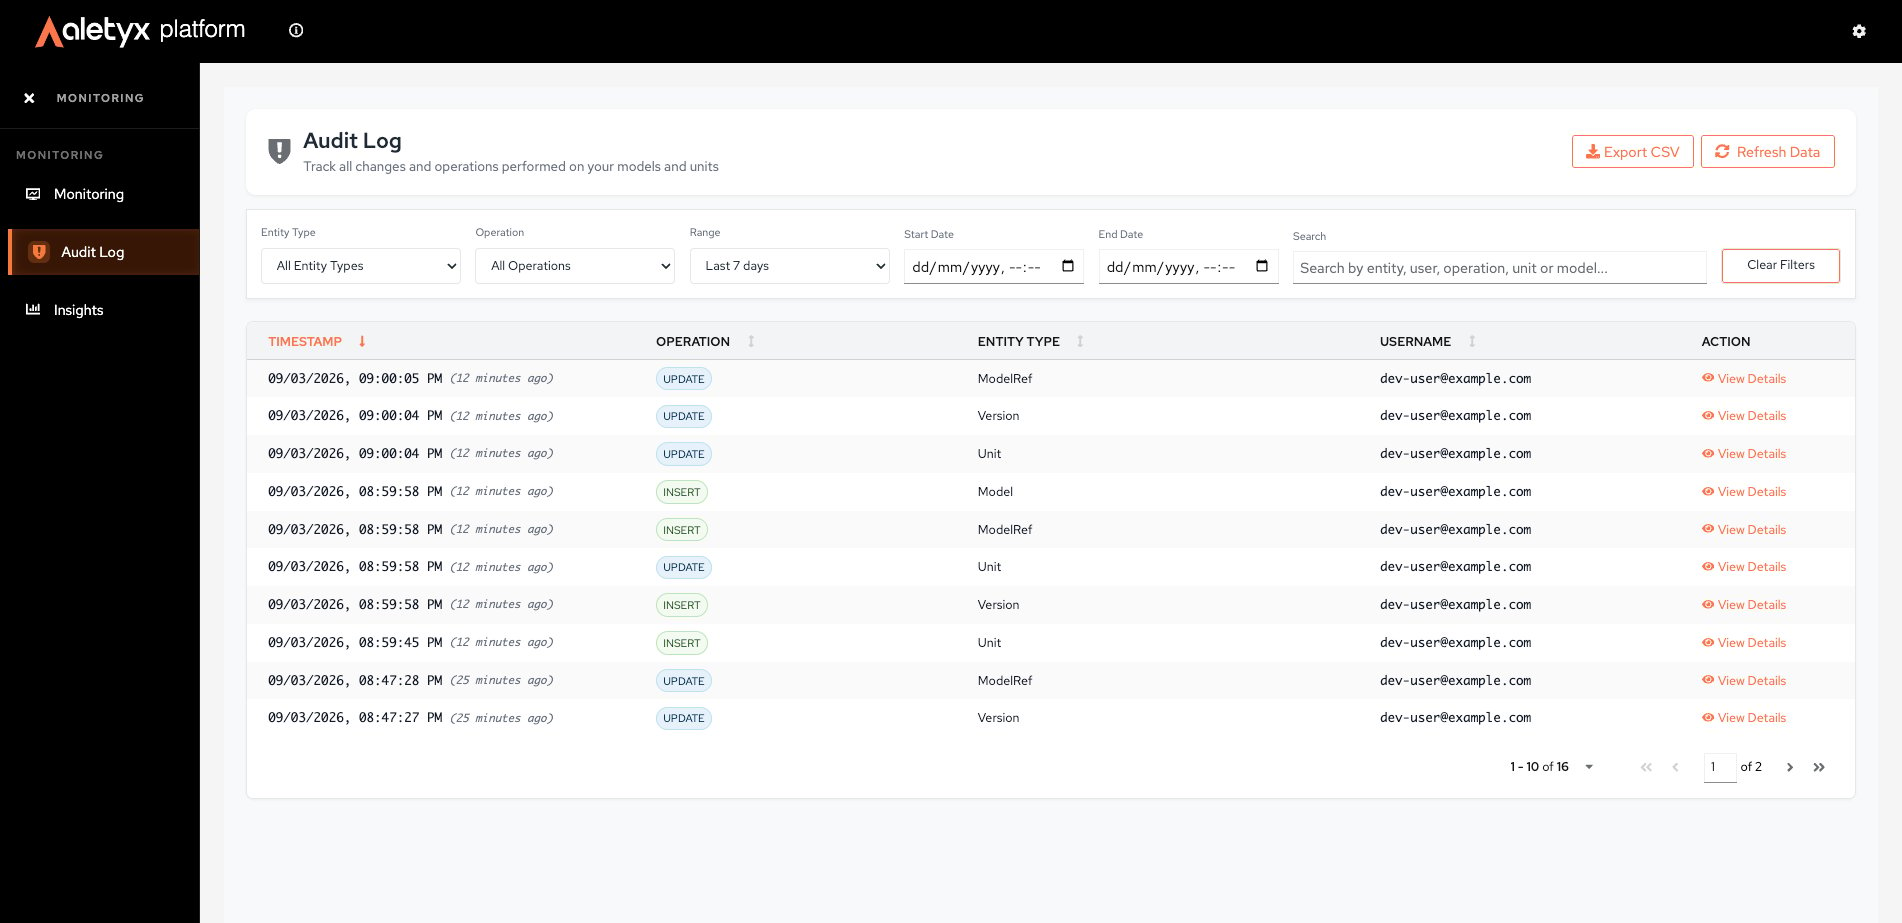
How to view and filter the audit log
Steps:- Open Monitoring → Audit Log.
- Use Search…, Entity Type, Operation (INSERT/UPDATE/DELETE), and Range/custom dates.
- Sort columns; Clear Filters to reset.
- Click View Details on a row for the full entry.
How to export the audit log to CSV
Download audit entries for offline review. Prerequisites: At least one audit entry (the button is disabled otherwise). Steps:- On Audit Log, apply any filters you want.
- Click Export CSV.
Insights
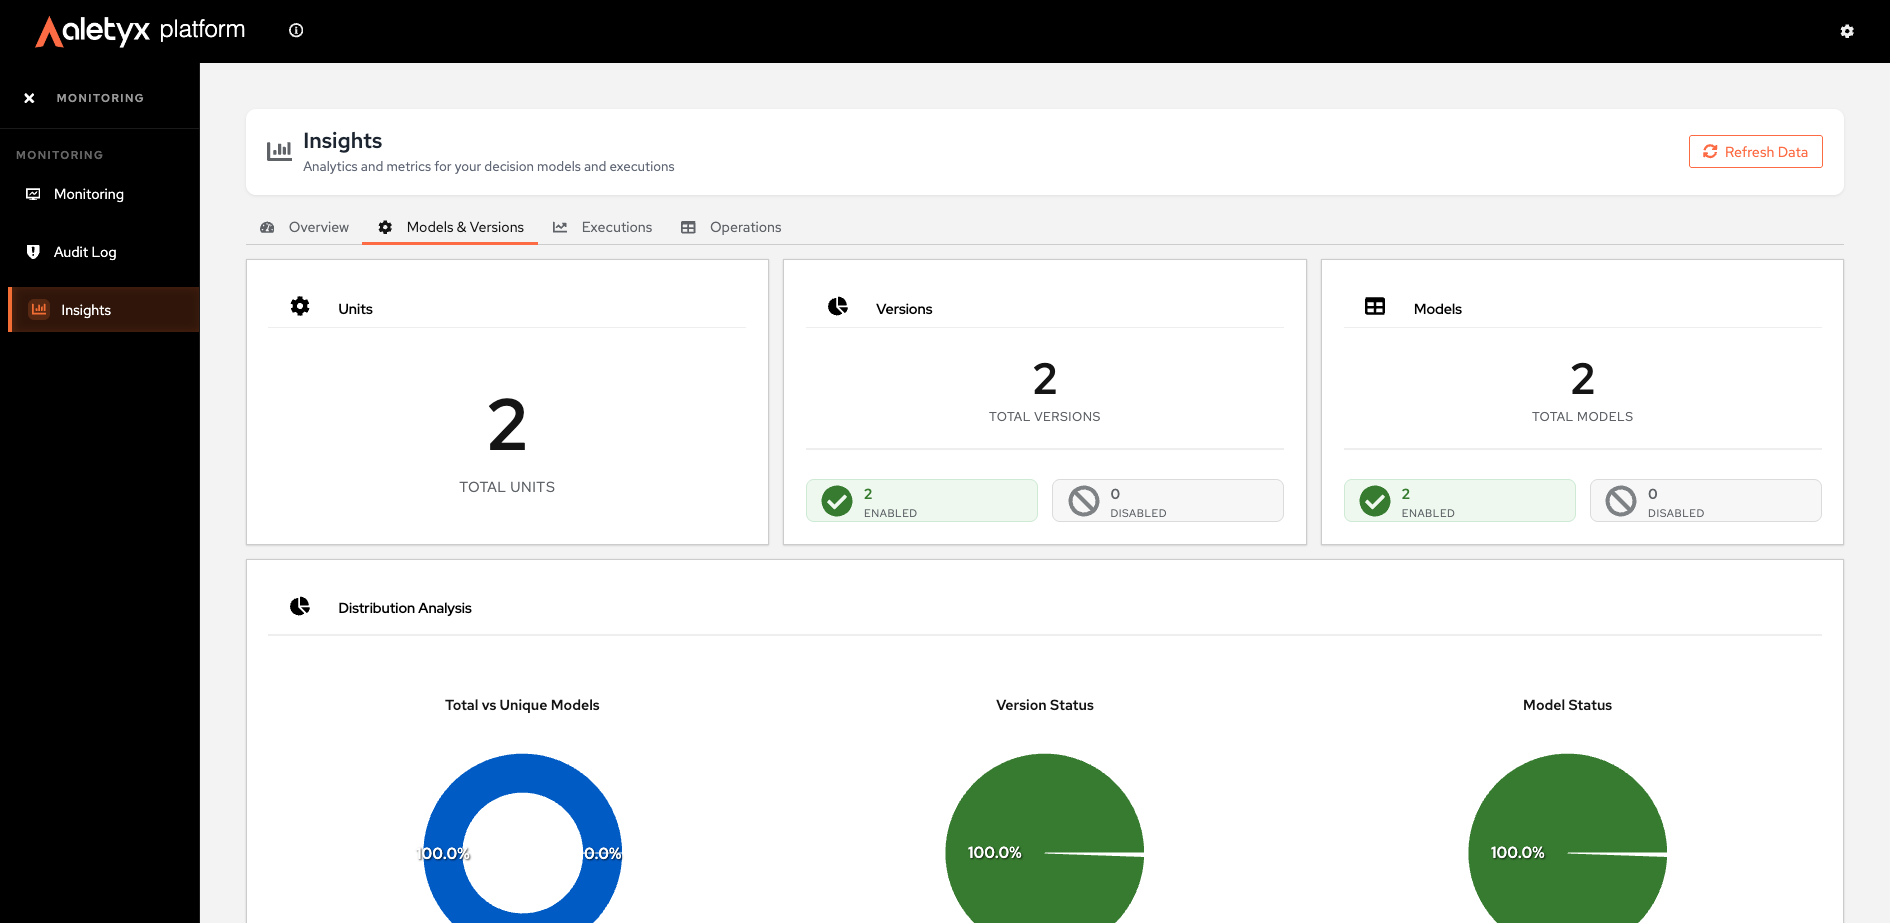
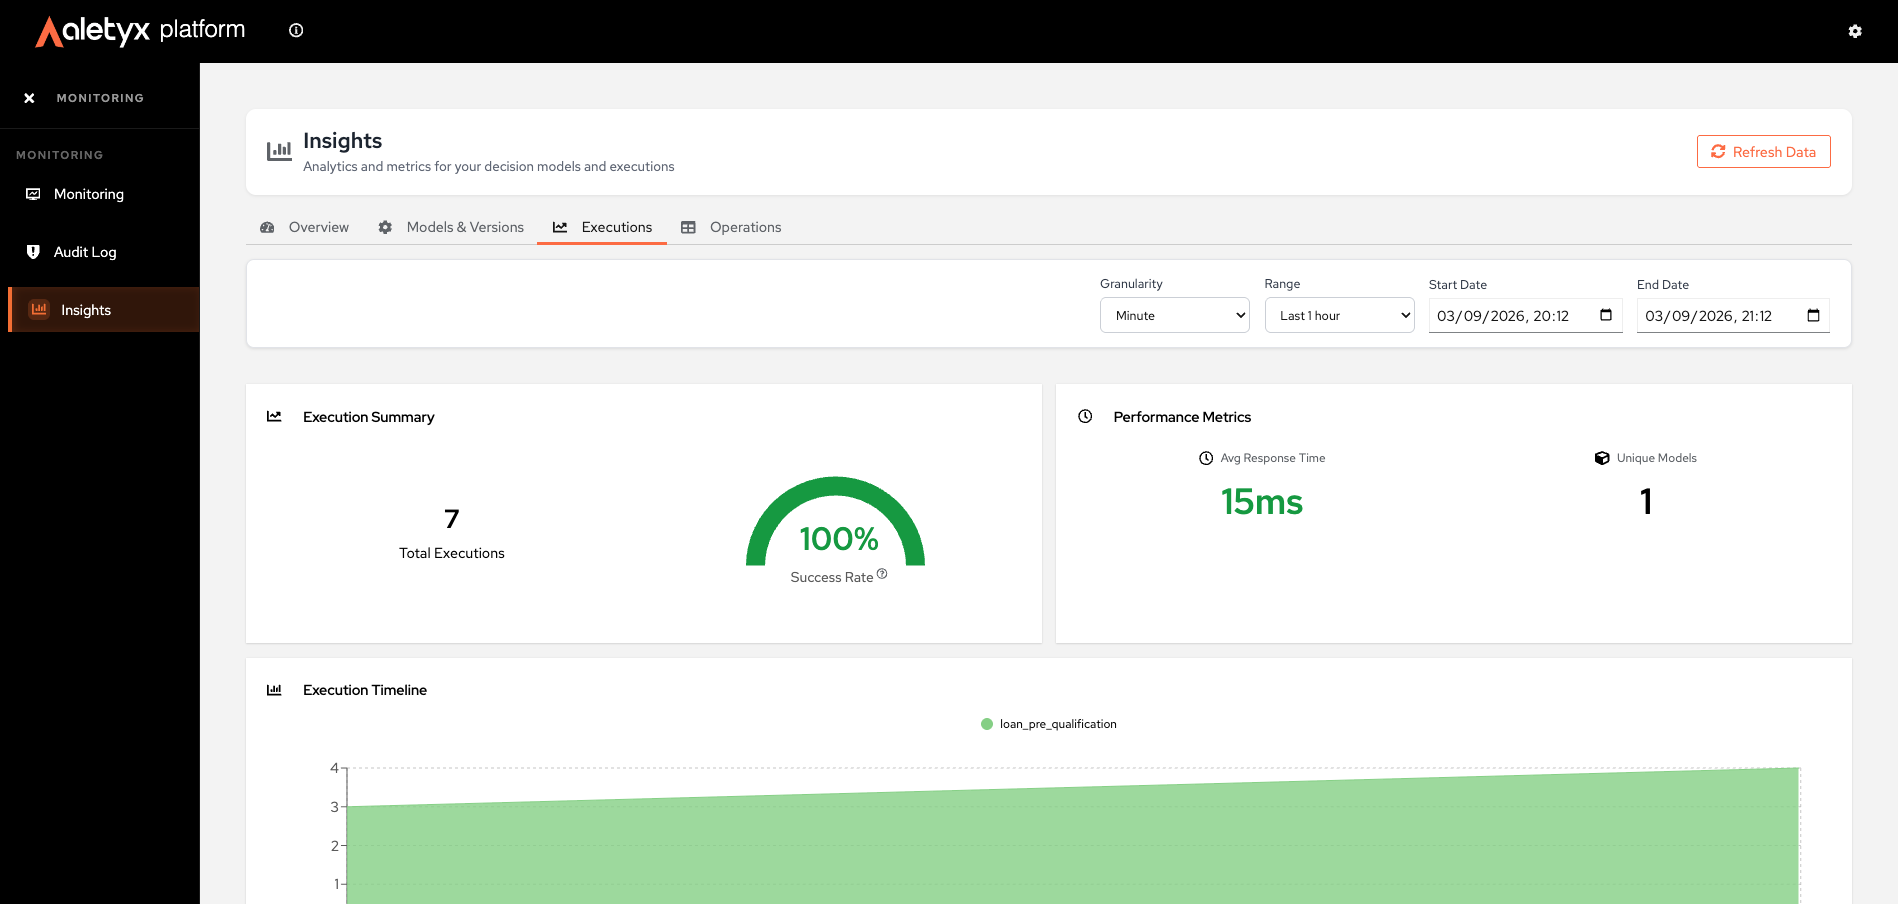
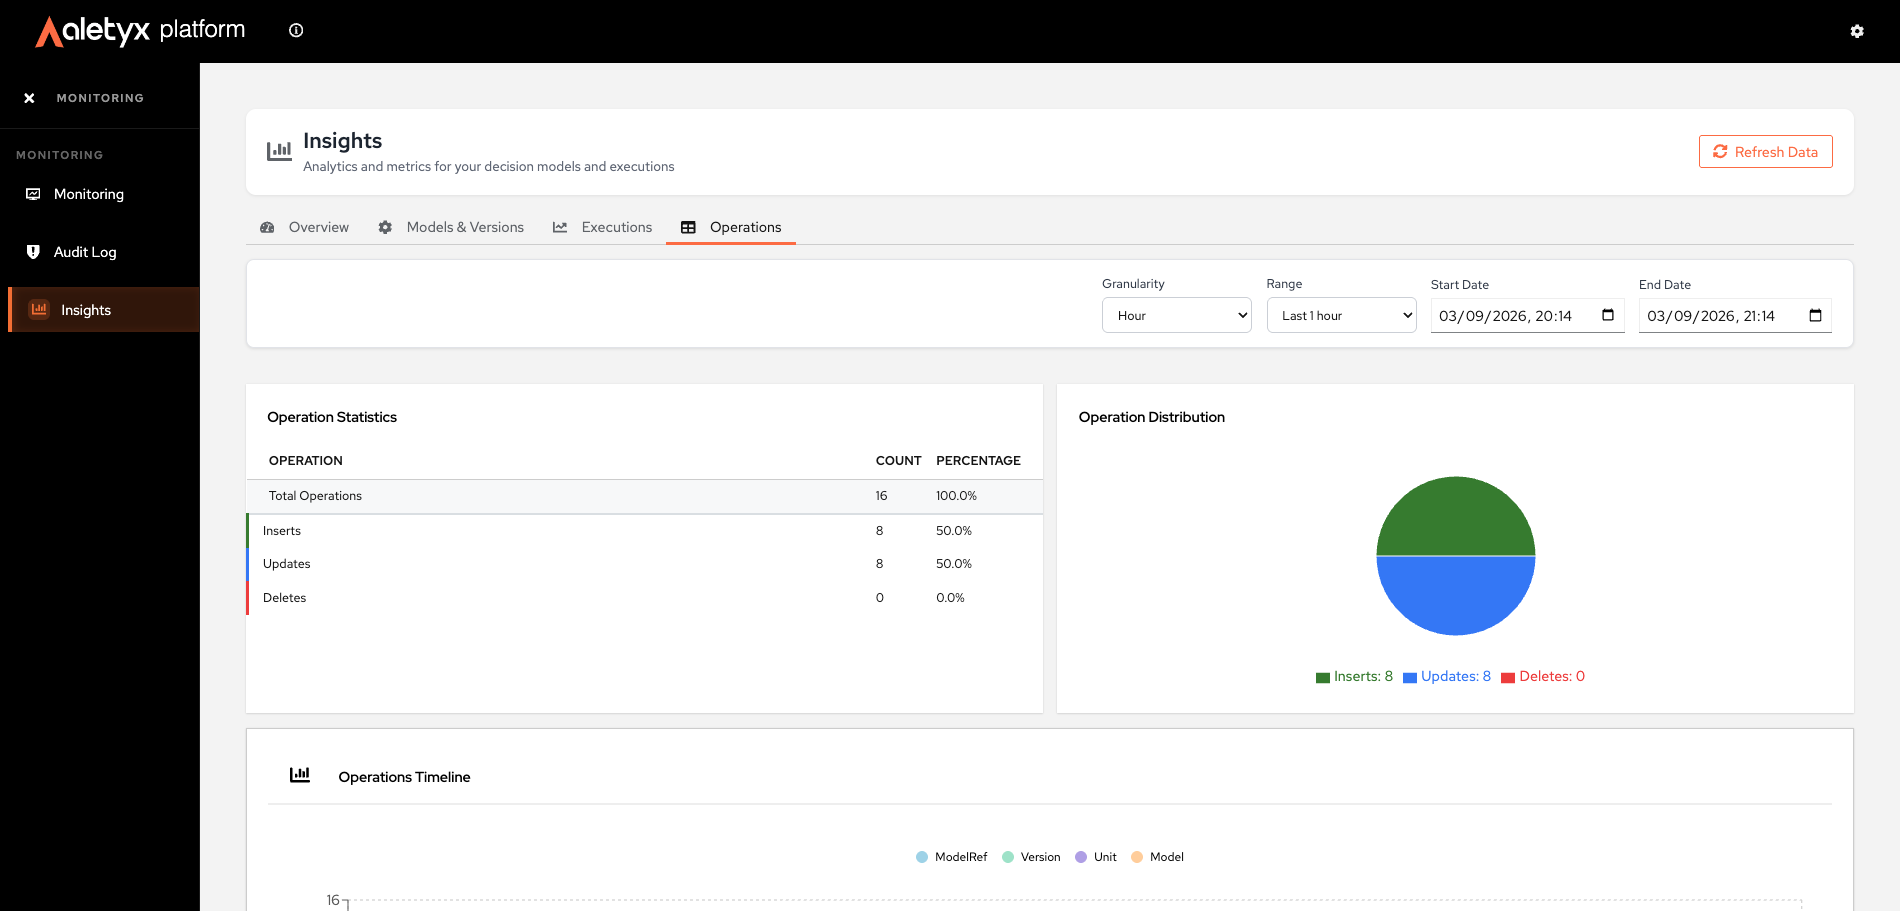
Insights has four views you switch between with tabs at the top:- Overview
- Models & Versions
- Executions
- Operations
Big-picture metric cards and the most recent activity at a glance.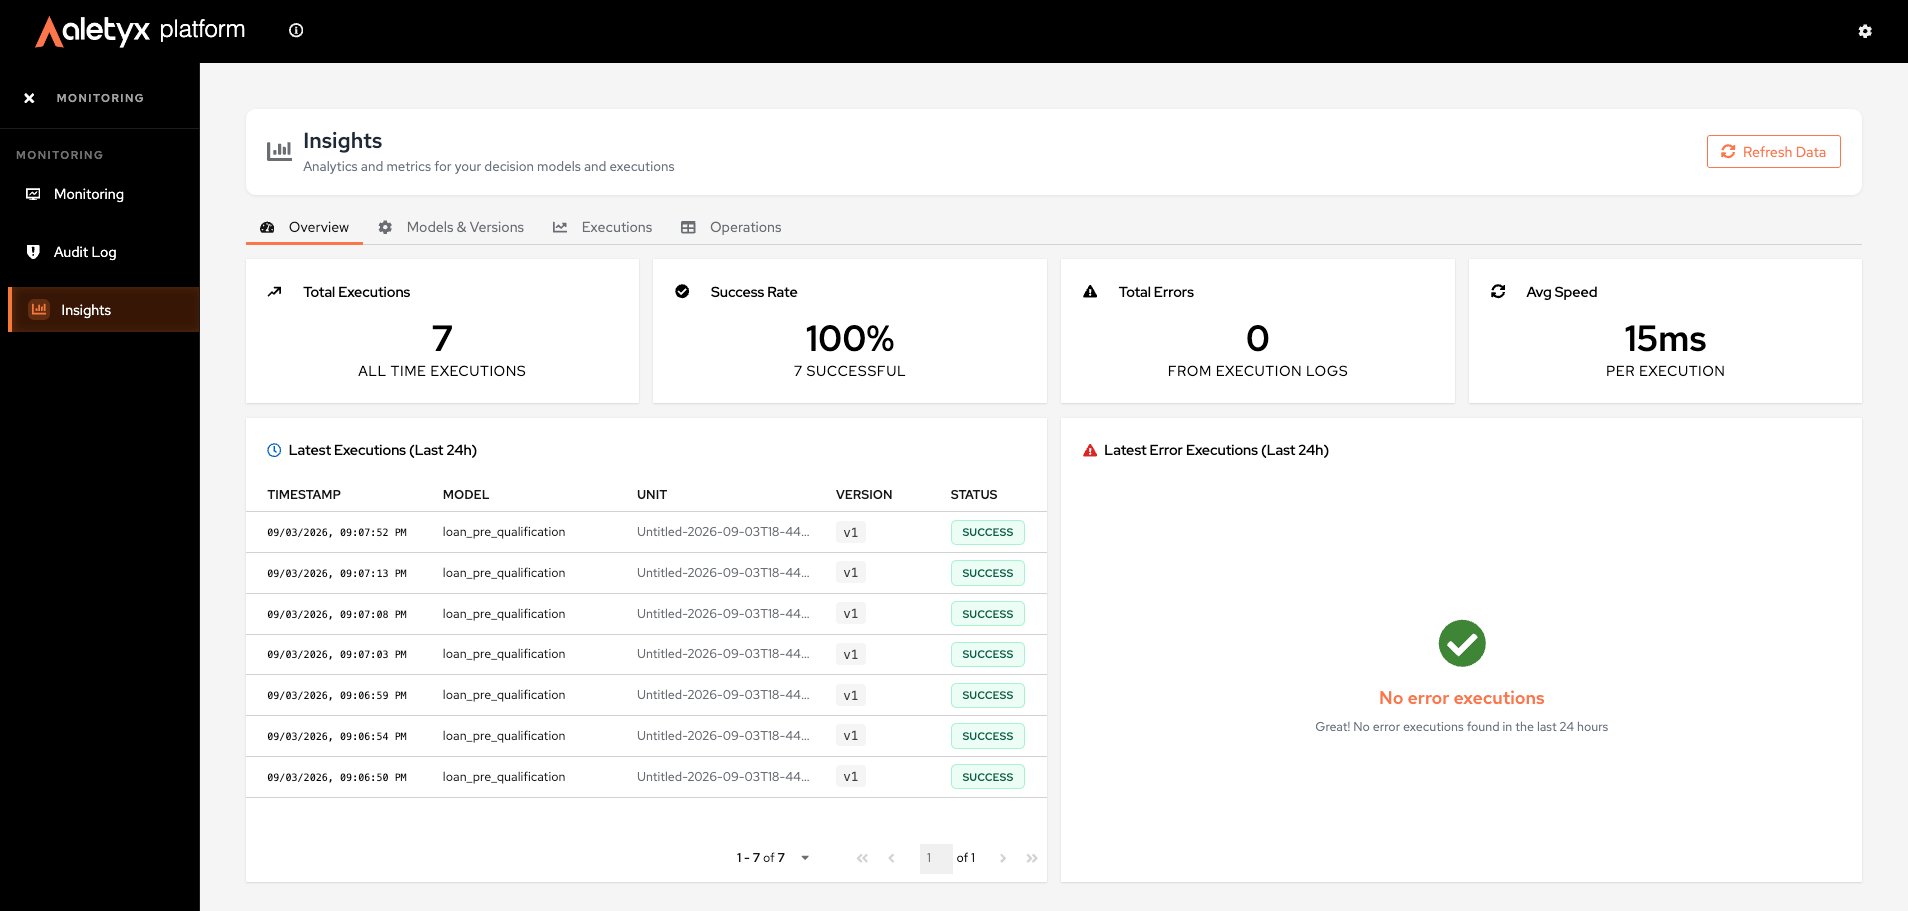
How to view insights and analytics
Steps:- Open Monitoring → Insights.
- Pick the tab you need (see above).
- Click Refresh Data to reload.