> ## Documentation Index
> Fetch the complete documentation index at: https://aletyx.ai/docs/llms.txt
> Use this file to discover all available pages before exploring further.
# Prometheus metrics monitoring in jBPM
> Prometheus is an open-source systems monitoring toolkit that you can use with jBPM to collect and store metrics related to the execution of business rules, processes, DMN models, and other jBPM assets.
Prometheus is an open-source systems monitoring toolkit that you can use with jBPM to collect and store metrics related to the execution of business rules, processes, Decision Model and Notation (DMN) models, and other jBPM assets. You can access the stored metrics through a REST API call to the KIE Server, through the Prometheus expression browser, or using a data-graphing tool such as Grafana.
You can configure Prometheus metrics monitoring for an on-premise KIE Server instance, for KIE Server on Spring Boot, or for a KIE Server deployment on Red Hat OpenShift Container Platform.
For the list of available metrics that KIE Server exposes with Prometheus,
see the [KIE Server Prometheus Extension](https://github.com/kiegroup/droolsjbpm-integration/tree/master/kie-server-parent/kie-server-services/kie-server-services-prometheus) page in GitHub.
## Configuring Prometheus metrics monitoring for KIE Server
You can configure your KIE Server instances to use Prometheus to collect and store metrics related to your business asset activity in jBPM. For the list of available metrics that KIE Server exposes with Prometheus,
see the [KIE Server Prometheus Extension](https://github.com/kiegroup/droolsjbpm-integration/tree/master/kie-server-parent/kie-server-services/kie-server-services-prometheus) page in GitHub.
**Prerequisites**
* KIE Server is installed.
* You have `kie-server` user role access to KIE Server.
* Prometheus is installed. For information about downloading and using Prometheus, see the [Prometheus documentation page](https://prometheus.io/docs/introduction/overview/).
**Procedure**
1. In your KIE Server instance, set the `org.kie.prometheus.server.ext.disabled` system property to `false` to enable the Prometheus extension. You can define this property when you start KIE Server or in the `standalone.xml` or `standalone-full.xml` file of the jBPM distribution.
2. If you are running jBPM on Spring Boot, configure the required key in the `application.properties` system property:
```properties Spring Boot application.properties key for jBPM and Prometheus theme={null}
kieserver.jbpm.enabled=true
kieserver.drools.enabled=true
kieserver.dmn.enabled=true
kieserver.prometheus.enabled=true
```
3. In the `prometheus.yaml` file of your Prometheus distribution, add the following settings in the `scrape_configs` section to configure Prometheus to scrape metrics from KIE Server:
```yaml Scrape configurations in prometheus.yaml file theme={null}
scrape_configs:
- job_name: 'kie-server'
metrics_path: /SERVER_PATH/services/rest/metrics
basicAuth:
username: USER_NAME
password: PASSWORD
static_configs:
- targets: ["HOST:PORT"]
```
```yaml Scrape configurations in prometheus.yaml file for Spring Boot (if applicable) theme={null}
scrape_configs:
- job_name: 'kie'
metrics_path: /rest/metrics
static_configs:
- targets: ["HOST:PORT"]
```
Replace the values according to your KIE Server location and settings.
4. Start the KIE Server instance.
After you start the configured KIE Server instance, Prometheus begins collecting metrics and KIE Server publishes the metrics to the REST API endpoint `http://HOST:PORT/SERVER/services/rest/metrics` (or on Spring Boot, to `http://HOST:PORT/rest/metrics`).
5. In a REST client or curl utility, send a REST API request with the following components to verify that KIE Server is publishing the metrics:
For REST client:
* **Authentication**: Enter the user name and password of the KIE Server user with the `kie-server` role.
* **HTTP Headers**: Set the following header:
* `Accept`: `application/json`
* **HTTP method**: Set to `GET`.
* **URL**: Enter the KIE Server REST API base URL and metrics endpoint, such as `http://localhost:8080/kie-server/services/rest/metrics` (or on Spring Boot, `http://localhost:8080/rest/metrics`).
For curl utility:
* `-u`: Enter the user name and password of the KIE Server user with the `kie-server` role.
* `-H`: Set the following header:
* `accept`: `application/json`
* `-X`: Set to `GET`.
* **URL**: Enter the KIE Server REST API base URL and metrics endpoint, such as `http://localhost:8080/kie-server/services/rest/metrics` (or on Spring Boot, `http://localhost:8080/rest/metrics`).
```bash Example curl command for jBPM on Wildfly theme={null}
curl -u 'baAdmin:password@1' -X GET "http://localhost:8080/kie-server/services/rest/metrics"
```
```bash Example curl command for jBPM on Spring Boot theme={null}
curl -u 'baAdmin:password@1' -X GET "http://localhost:8080/rest/metrics"
```
```text Example server response theme={null}
# HELP kie_server_container_started_total Kie Server Started Containers
# TYPE kie_server_container_started_total counter
kie_server_container_started_total{container_id="task-assignment-kjar-1.0",} 1.0
# HELP solvers_running Number of solvers currently running
# TYPE solvers_running gauge
solvers_running 0.0
# HELP dmn_evaluate_decision_nanosecond DMN Evaluation Time
# TYPE dmn_evaluate_decision_nanosecond histogram
# HELP solver_duration_seconds Time in seconds it took solver to solve the constraint problem
# TYPE solver_duration_seconds summary
solver_duration_seconds_count{solver_id="100tasks-5employees.xml",} 1.0
solver_duration_seconds_sum{solver_id="100tasks-5employees.xml",} 179.828255925
solver_duration_seconds_count{solver_id="24tasks-8employees.xml",} 1.0
solver_duration_seconds_sum{solver_id="24tasks-8employees.xml",} 179.995759653
# HELP drl_match_fired_nanosecond Drools Firing Time
# TYPE drl_match_fired_nanosecond histogram
# HELP dmn_evaluate_failed_count DMN Evaluation Failed
# TYPE dmn_evaluate_failed_count counter
# HELP kie_server_start_time Kie Server Start Time
# TYPE kie_server_start_time gauge
kie_server_start_time{name="myapp-kieserver",server_id="myapp-kieserver",location="http://myapp-kieserver-demo-monitoring.127.0.0.1.nip.io:80/services/rest/server",version="7.4.0.redhat-20190428",} 1.557221271502E12
# HELP kie_server_container_running_total Kie Server Running Containers
# TYPE kie_server_container_running_total gauge
kie_server_container_running_total{container_id="task-assignment-kjar-1.0",} 1.0
# HELP solver_score_calculation_speed Number of moves per second for a particular solver solving the constraint problem
# TYPE solver_score_calculation_speed summary
solver_score_calculation_speed_count{solver_id="100tasks-5employees.xml",} 1.0
solver_score_calculation_speed_sum{solver_id="100tasks-5employees.xml",} 6997.0
solver_score_calculation_speed_count{solver_id="24tasks-8employees.xml",} 1.0
solver_score_calculation_speed_sum{solver_id="24tasks-8employees.xml",} 19772.0
# HELP kie_server_case_started_total Kie Server Started Cases
# TYPE kie_server_case_started_total counter
kie_server_case_started_total{case_definition_id="itorders.orderhardware",} 1.0
# HELP kie_server_case_running_total Kie Server Running Cases
# TYPE kie_server_case_running_total gauge
kie_server_case_running_total{case_definition_id="itorders.orderhardware",} 2.0
# HELP kie_server_data_set_registered_total Kie Server Data Set Registered
# TYPE kie_server_data_set_registered_total gauge
kie_server_data_set_registered_total{name="jbpmProcessInstanceLogs::CUSTOM",uuid="jbpmProcessInstanceLogs",} 1.0
kie_server_data_set_registered_total{name="jbpmRequestList::CUSTOM",uuid="jbpmRequestList",} 1.0
kie_server_data_set_registered_total{name="tasksMonitoring::CUSTOM",uuid="tasksMonitoring",} 1.0
kie_server_data_set_registered_total{name="jbpmHumanTasks::CUSTOM",uuid="jbpmHumanTasks",} 1.0
kie_server_data_set_registered_total{name="jbpmHumanTasksWithUser::FILTERED_PO_TASK",uuid="jbpmHumanTasksWithUser",} 1.0
kie_server_data_set_registered_total{name="jbpmHumanTasksWithVariables::CUSTOM",uuid="jbpmHumanTasksWithVariables",} 1.0
kie_server_data_set_registered_total{name="jbpmProcessInstancesWithVariables::CUSTOM",uuid="jbpmProcessInstancesWithVariables",} 1.0
kie_server_data_set_registered_total{name="jbpmProcessInstances::CUSTOM",uuid="jbpmProcessInstances",} 1.0
kie_server_data_set_registered_total{name="jbpmExecutionErrorList::CUSTOM",uuid="jbpmExecutionErrorList",} 1.0
kie_server_data_set_registered_total{name="processesMonitoring::CUSTOM",uuid="processesMonitoring",} 1.0
kie_server_data_set_registered_total{name="jbpmHumanTasksWithAdmin::FILTERED_BA_TASK",uuid="jbpmHumanTasksWithAdmin",} 1.0
# HELP kie_server_execution_error_total Kie Server Execution Errors
# TYPE kie_server_execution_error_total counter
# HELP kie_server_task_completed_total Kie Server Completed Tasks
# TYPE kie_server_task_completed_total counter
# HELP kie_server_container_running_total Kie Server Running Containers
# TYPE kie_server_container_running_total gauge
kie_server_container_running_total{container_id="itorders_1.0.0-SNAPSHOT",} 1.0
# HELP kie_server_job_cancelled_total Kie Server Cancelled Jobs
# TYPE kie_server_job_cancelled_total counter
# HELP kie_server_process_instance_started_total Kie Server Started Process Instances
# TYPE kie_server_process_instance_started_total counter
kie_server_process_instance_started_total{container_id="itorders_1.0.0-SNAPSHOT",process_id="itorders.orderhardware",} 1.0
# HELP solver_duration_seconds Time in seconds it took solver to solve the constraint problem
# TYPE solver_duration_seconds summary
# HELP kie_server_task_skipped_total Kie Server Skipped Tasks
# TYPE kie_server_task_skipped_total counter
# HELP kie_server_data_set_execution_time_seconds Kie Server Data Set Execution Time
# TYPE kie_server_data_set_execution_time_seconds summary
kie_server_data_set_execution_time_seconds_count{uuid="jbpmProcessInstances",} 8.0
kie_server_data_set_execution_time_seconds_sum{uuid="jbpmProcessInstances",} 0.05600000000000001
# HELP kie_server_job_scheduled_total Kie Server Started Jobs
# TYPE kie_server_job_scheduled_total counter
# HELP kie_server_data_set_execution_total Kie Server Data Set Execution
# TYPE kie_server_data_set_execution_total counter
kie_server_data_set_execution_total{uuid="jbpmProcessInstances",} 8.0
# HELP kie_server_process_instance_completed_total Kie Server Completed Process Instances
# TYPE kie_server_process_instance_completed_total counter
# HELP kie_server_job_running_total Kie Server Running Jobs
# TYPE kie_server_job_running_total gauge
# HELP kie_server_task_failed_total Kie Server Failed Tasks
# TYPE kie_server_task_failed_total counter
# HELP kie_server_task_exited_total Kie Server Exited Tasks
# TYPE kie_server_task_exited_total counter
# HELP dmn_evaluate_decision_nanosecond DMN Evaluation Time
# TYPE dmn_evaluate_decision_nanosecond histogram
# HELP kie_server_data_set_lookups_total Kie Server Data Set Running Lookups
# TYPE kie_server_data_set_lookups_total gauge
kie_server_data_set_lookups_total{uuid="jbpmProcessInstances",} 0.0
# HELP kie_server_process_instance_duration_seconds Kie Server Process Instances Duration
# TYPE kie_server_process_instance_duration_seconds summary
# HELP kie_server_case_duration_seconds Kie Server Case Duration
# TYPE kie_server_case_duration_seconds summary
# HELP dmn_evaluate_failed_count DMN Evaluation Failed
# TYPE dmn_evaluate_failed_count counter
# HELP kie_server_task_added_total Kie Server Added Tasks
# TYPE kie_server_task_added_total counter
kie_server_task_added_total{deployment_id="itorders_1.0.0-SNAPSHOT",process_id="itorders.orderhardware",task_name="Prepare hardware spec",} 1.0
# HELP drl_match_fired_nanosecond Drools Firing Time
# TYPE drl_match_fired_nanosecond histogram
# HELP kie_server_container_started_total Kie Server Started Containers
# TYPE kie_server_container_started_total counter
kie_server_container_started_total{container_id="itorders_1.0.0-SNAPSHOT",} 1.0
# HELP kie_server_process_instance_sla_violated_total Kie Server Process Instances SLA Violated
# TYPE kie_server_process_instance_sla_violated_total counter
# HELP kie_server_task_duration_seconds Kie Server Task Duration
# TYPE kie_server_task_duration_seconds summary
# HELP kie_server_job_executed_total Kie Server Executed Jobs
# TYPE kie_server_job_executed_total counter
# HELP kie_server_deployments_active_total Kie Server Active Deployments
# TYPE kie_server_deployments_active_total gauge
kie_server_deployments_active_total{deployment_id="itorders_1.0.0-SNAPSHOT",} 1.0
# HELP kie_server_process_instance_running_total Kie Server Running Process Instances
# TYPE kie_server_process_instance_running_total gauge
kie_server_process_instance_running_total{container_id="itorders_1.0.0-SNAPSHOT",process_id="itorders.orderhardware",} 2.0
# HELP solvers_running Number of solvers currently running
# TYPE solvers_running gauge
solvers_running 0.0
# HELP kie_server_work_item_duration_seconds Kie Server Work Items Duration
# TYPE kie_server_work_item_duration_seconds summary
# HELP kie_server_job_duration_seconds Kie Server Job Duration
# TYPE kie_server_job_duration_seconds summary
# HELP solver_score_calculation_speed Number of moves per second for a particular solver solving the constraint problem
# TYPE solver_score_calculation_speed summary
# HELP kie_server_start_time Kie Server Start Time
# TYPE kie_server_start_time gauge
kie_server_start_time{name="sample-server",server_id="sample-server",location="http://localhost:8080/kie-server/services/rest/server",version="7.68.0-SNAPSHOT",} 1.557285486469E12
```
If the metrics are not available in KIE Server, review and verify the KIE Server and Prometheus configurations described in this section.
You can also interact with your collected metrics in the Prometheus expression browser at `http://HOST:PORT/graph`, or integrate your Prometheus data source with a data-graphing tool such as Grafana:
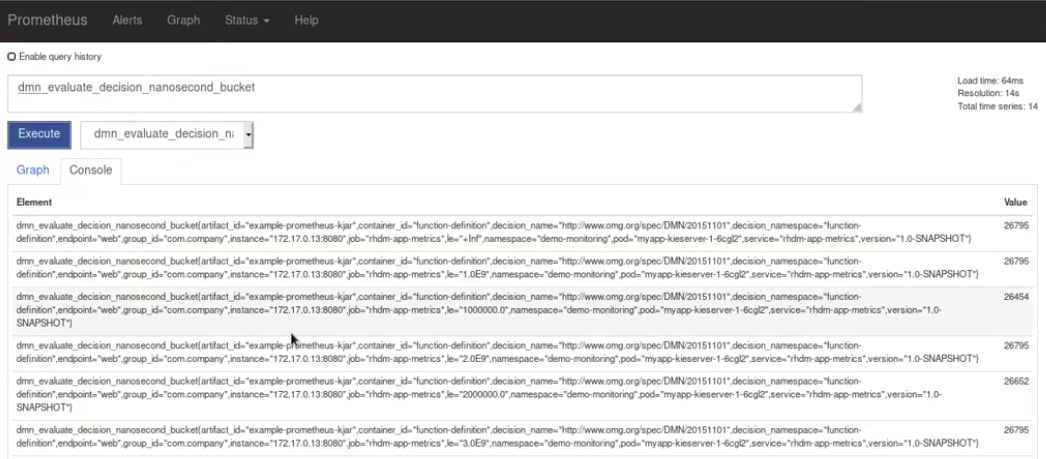 *Prometheus expression browser with KIE Server metrics*
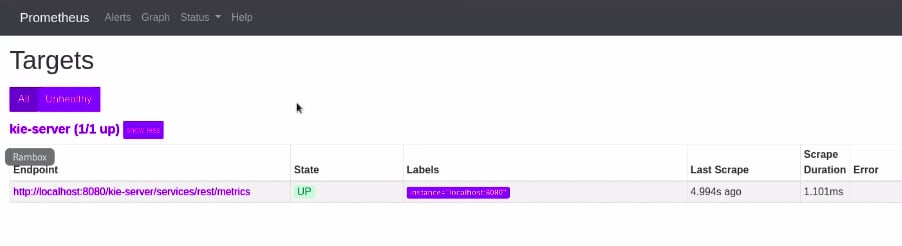 *Prometheus expression browser with KIE Server target*
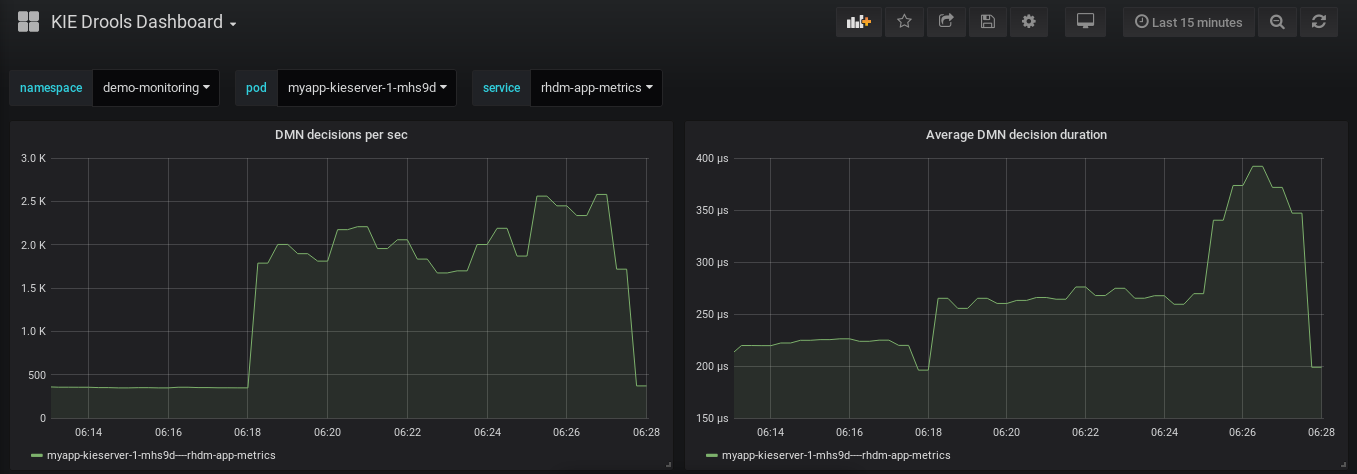 *Grafana dashboard with KIE Server metrics for DMN models*
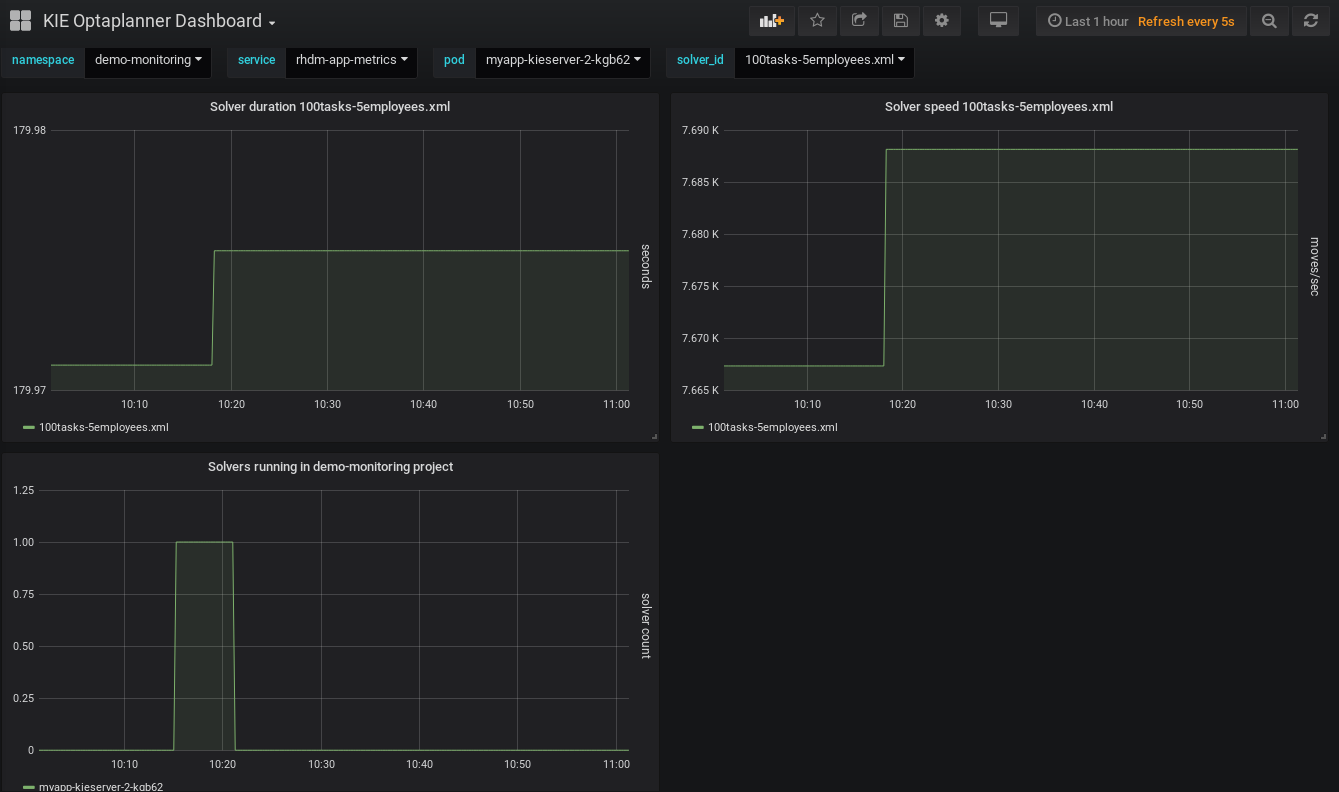 *Grafana dashboard with KIE Server metrics for solvers*
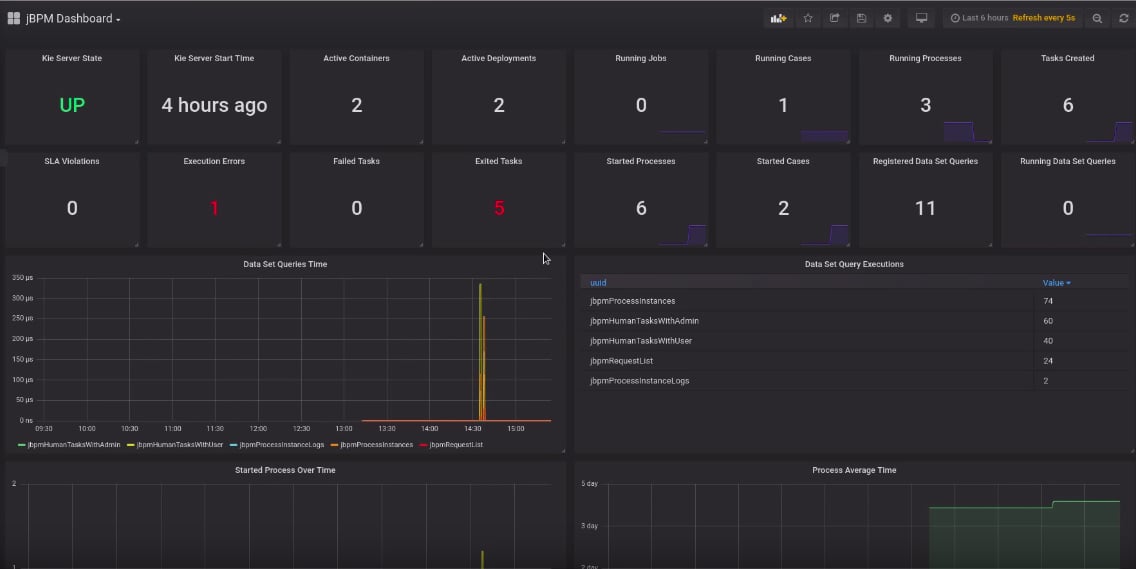 *Grafana dashboard with KIE Server metrics for processes, cases, and tasks*
**Additional resources**
* [Getting Started with Prometheus](https://prometheus.io/docs/prometheus/latest/getting_started/)
* [Grafana Support for Prometheus](https://prometheus.io/docs/visualization/grafana/)
* [Using Prometheus in Grafana](https://grafana.com/docs/features/datasources/prometheus/)
## Extending Prometheus metrics monitoring in KIE Server with custom metrics
After you configure your KIE Server instance to use Prometheus metrics monitoring, you can extend the Prometheus functionality in KIE Server to use custom metrics according to your business needs. Prometheus then collects and stores your custom metrics along with the default metrics that KIE Server exposes with Prometheus.
As an example, this procedure defines custom Decision Model and Notation (DMN) metrics to be collected and stored by Prometheus.
**Prerequisites**
* Prometheus metrics monitoring is configured for your KIE Server instance. For information about Prometheus configuration with KIE Server on-premise, see
[Configuring Prometheus metrics monitoring for KIE Server](#configuring-prometheus-metrics-monitoring-for-kie-server).
**Procedure**
1. Create an empty Maven project and define the following packaging type and dependencies in the `pom.xml` file for the project:
```xml Example pom.xml file in the sample project theme={null}
jar
7.67.2.Final
org.kie
kie-api
${version.org.kie}
org.kie.server
kie-server-api
${version.org.kie}
org.kie.server
kie-server-services-common
${version.org.kie}
org.kie.server
kie-server-services-drools
${version.org.kie}
org.kie.server
kie-server-services-prometheus
${version.org.kie}
org.kie
kie-dmn-api
${version.org.kie}
org.kie
kie-dmn-core
${version.org.kie}
org.jbpm
jbpm-services-api
${version.org.kie}
org.jbpm
jbpm-executor
${version.org.kie}
io.prometheus
simpleclient
0.5.0
```
2. Implement the relevant listener from the `org.kie.server.services.prometheus.PrometheusMetricsProvider` interface as part of the custom listener class that defines your custom Prometheus metrics, as shown in the following example:
```java Sample implementation of the DMNRuntimeEventListener listener in a custom listener class theme={null}
package org.kie.server.ext.prometheus;
import io.prometheus.client.Gauge;
import org.kie.dmn.api.core.ast.DecisionNode;
import org.kie.dmn.api.core.event.AfterEvaluateBKMEvent;
import org.kie.dmn.api.core.event.AfterEvaluateContextEntryEvent;
import org.kie.dmn.api.core.event.AfterEvaluateDecisionEvent;
import org.kie.dmn.api.core.event.AfterEvaluateDecisionServiceEvent;
import org.kie.dmn.api.core.event.AfterEvaluateDecisionTableEvent;
import org.kie.dmn.api.core.event.BeforeEvaluateBKMEvent;
import org.kie.dmn.api.core.event.BeforeEvaluateContextEntryEvent;
import org.kie.dmn.api.core.event.BeforeEvaluateDecisionEvent;
import org.kie.dmn.api.core.event.BeforeEvaluateDecisionServiceEvent;
import org.kie.dmn.api.core.event.BeforeEvaluateDecisionTableEvent;
import org.kie.dmn.api.core.event.DMNRuntimeEventListener;
import org.kie.server.api.model.ReleaseId;
import org.kie.server.services.api.KieContainerInstance;
public class ExampleCustomPrometheusMetricListener implements DMNRuntimeEventListener {
private final KieContainerInstance kieContainer;
private final Gauge randomGauge = Gauge.build()
.name("random_gauge_nanosecond")
.help("Random gauge as an example of custom KIE Prometheus metric")
.labelNames("container_id", "group_id", "artifact_id", "version", "decision_namespace", "decision_name")
.register();
public ExampleCustomPrometheusMetricListener(KieContainerInstance containerInstance) {
kieContainer = containerInstance;
}
public void beforeEvaluateDecision(BeforeEvaluateDecisionEvent e) {
}
public void afterEvaluateDecision(AfterEvaluateDecisionEvent e) {
DecisionNode decisionNode = e.getDecision();
ReleaseId releaseId = kieContainer.getResource().getReleaseId();
randomGauge.labels(kieContainer.getContainerId(), releaseId.getGroupId(),
releaseId.getArtifactId(), releaseId.getVersion(),
decisionNode.getModelName(), decisionNode.getModelNamespace())
.set((int) (Math.random() * 100));
}
public void beforeEvaluateBKM(BeforeEvaluateBKMEvent event) {
}
public void afterEvaluateBKM(AfterEvaluateBKMEvent event) {
}
public void beforeEvaluateContextEntry(BeforeEvaluateContextEntryEvent event) {
}
public void afterEvaluateContextEntry(AfterEvaluateContextEntryEvent event) {
}
public void beforeEvaluateDecisionTable(BeforeEvaluateDecisionTableEvent event) {
}
public void afterEvaluateDecisionTable(AfterEvaluateDecisionTableEvent event) {
}
public void beforeEvaluateDecisionService(BeforeEvaluateDecisionServiceEvent event) {
}
public void afterEvaluateDecisionService(AfterEvaluateDecisionServiceEvent event) {
}
}
```
The `PrometheusMetricsProvider` interface contains the required listeners for collecting Prometheus metrics. The interface is incorporated by the `kie-server-services-prometheus` dependency that you declared in your project `pom.xml` file.
In this example, the `ExampleCustomPrometheusMetricListener` class implements the `DMNRuntimeEventListener` listener (from the `PrometheusMetricsProvider` interface) and defines the custom DMN metrics to be collected and stored by Prometheus.
3. Implement the `PrometheusMetricsProvider` interface as part of a custom metrics provider class that associates your custom listener with the `PrometheusMetricsProvider` interface, as shown in the following example:
```java Sample implementation of the PrometheusMetricsProvider interface in a custom metrics provider class theme={null}
package org.kie.server.ext.prometheus;
import org.jbpm.executor.AsynchronousJobListener;
import org.jbpm.services.api.DeploymentEventListener;
import org.kie.api.event.rule.AgendaEventListener;
import org.kie.api.event.rule.DefaultAgendaEventListener;
import org.kie.dmn.api.core.event.DMNRuntimeEventListener;
import org.kie.server.services.api.KieContainerInstance;
import org.kie.server.services.prometheus.PrometheusMetricsProvider;
public class MyPrometheusMetricsProvider implements PrometheusMetricsProvider {
public DMNRuntimeEventListener createDMNRuntimeEventListener(KieContainerInstance kContainer) {
return new ExampleCustomPrometheusMetricListener(kContainer);
}
public AgendaEventListener createAgendaEventListener(String kieSessionId, KieContainerInstance kContainer) {
return new DefaultAgendaEventListener();
}
public PhaseLifecycleListener createPhaseLifecycleListener(String solverId) {
return new PhaseLifecycleListenerAdapter() {
};
}
public AsynchronousJobListener createAsynchronousJobListener() {
return null;
}
public DeploymentEventListener createDeploymentEventListener() {
return null;
}
}
```
In this example, the `MyPrometheusMetricsProvider` class implements the `PrometheusMetricsProvider` interface and includes your custom `ExampleCustomPrometheusMetricListener` listener class.
4. To make the new metrics provider discoverable for KIE Server, create a `META-INF/services/org.kie.server.services.prometheus.PrometheusMetricsProvider` file in your Maven project and add the fully qualified class name of the `PrometheusMetricsProvider` implementation class within the file. For this example, the file contains the single line `org.kie.server.ext.prometheus.MyPrometheusMetricsProvider`.
5. Build your project and copy the resulting JAR file into the `~/kie-server.war/WEB-INF/lib` directory of your project.
6. Start the KIE Server and deploy the built project to the running KIE Server. You can deploy the project using the Business Central interface or the KIE Server REST API (a `PUT` request to `http://SERVER:PORT/kie-server/services/rest/server/containers/{containerId}`).
After your project is deployed on a running KIE Server, Prometheus begins collecting metrics and KIE Server publishes the metrics to the REST API endpoint `http://HOST:PORT/SERVER/services/rest/metrics` (or on Spring Boot, to `http://HOST:PORT/rest/metrics`).
*Grafana dashboard with KIE Server metrics for processes, cases, and tasks*
**Additional resources**
* [Getting Started with Prometheus](https://prometheus.io/docs/prometheus/latest/getting_started/)
* [Grafana Support for Prometheus](https://prometheus.io/docs/visualization/grafana/)
* [Using Prometheus in Grafana](https://grafana.com/docs/features/datasources/prometheus/)
## Extending Prometheus metrics monitoring in KIE Server with custom metrics
After you configure your KIE Server instance to use Prometheus metrics monitoring, you can extend the Prometheus functionality in KIE Server to use custom metrics according to your business needs. Prometheus then collects and stores your custom metrics along with the default metrics that KIE Server exposes with Prometheus.
As an example, this procedure defines custom Decision Model and Notation (DMN) metrics to be collected and stored by Prometheus.
**Prerequisites**
* Prometheus metrics monitoring is configured for your KIE Server instance. For information about Prometheus configuration with KIE Server on-premise, see
[Configuring Prometheus metrics monitoring for KIE Server](#configuring-prometheus-metrics-monitoring-for-kie-server).
**Procedure**
1. Create an empty Maven project and define the following packaging type and dependencies in the `pom.xml` file for the project:
```xml Example pom.xml file in the sample project theme={null}
jar
7.67.2.Final
org.kie
kie-api
${version.org.kie}
org.kie.server
kie-server-api
${version.org.kie}
org.kie.server
kie-server-services-common
${version.org.kie}
org.kie.server
kie-server-services-drools
${version.org.kie}
org.kie.server
kie-server-services-prometheus
${version.org.kie}
org.kie
kie-dmn-api
${version.org.kie}
org.kie
kie-dmn-core
${version.org.kie}
org.jbpm
jbpm-services-api
${version.org.kie}
org.jbpm
jbpm-executor
${version.org.kie}
io.prometheus
simpleclient
0.5.0
```
2. Implement the relevant listener from the `org.kie.server.services.prometheus.PrometheusMetricsProvider` interface as part of the custom listener class that defines your custom Prometheus metrics, as shown in the following example:
```java Sample implementation of the DMNRuntimeEventListener listener in a custom listener class theme={null}
package org.kie.server.ext.prometheus;
import io.prometheus.client.Gauge;
import org.kie.dmn.api.core.ast.DecisionNode;
import org.kie.dmn.api.core.event.AfterEvaluateBKMEvent;
import org.kie.dmn.api.core.event.AfterEvaluateContextEntryEvent;
import org.kie.dmn.api.core.event.AfterEvaluateDecisionEvent;
import org.kie.dmn.api.core.event.AfterEvaluateDecisionServiceEvent;
import org.kie.dmn.api.core.event.AfterEvaluateDecisionTableEvent;
import org.kie.dmn.api.core.event.BeforeEvaluateBKMEvent;
import org.kie.dmn.api.core.event.BeforeEvaluateContextEntryEvent;
import org.kie.dmn.api.core.event.BeforeEvaluateDecisionEvent;
import org.kie.dmn.api.core.event.BeforeEvaluateDecisionServiceEvent;
import org.kie.dmn.api.core.event.BeforeEvaluateDecisionTableEvent;
import org.kie.dmn.api.core.event.DMNRuntimeEventListener;
import org.kie.server.api.model.ReleaseId;
import org.kie.server.services.api.KieContainerInstance;
public class ExampleCustomPrometheusMetricListener implements DMNRuntimeEventListener {
private final KieContainerInstance kieContainer;
private final Gauge randomGauge = Gauge.build()
.name("random_gauge_nanosecond")
.help("Random gauge as an example of custom KIE Prometheus metric")
.labelNames("container_id", "group_id", "artifact_id", "version", "decision_namespace", "decision_name")
.register();
public ExampleCustomPrometheusMetricListener(KieContainerInstance containerInstance) {
kieContainer = containerInstance;
}
public void beforeEvaluateDecision(BeforeEvaluateDecisionEvent e) {
}
public void afterEvaluateDecision(AfterEvaluateDecisionEvent e) {
DecisionNode decisionNode = e.getDecision();
ReleaseId releaseId = kieContainer.getResource().getReleaseId();
randomGauge.labels(kieContainer.getContainerId(), releaseId.getGroupId(),
releaseId.getArtifactId(), releaseId.getVersion(),
decisionNode.getModelName(), decisionNode.getModelNamespace())
.set((int) (Math.random() * 100));
}
public void beforeEvaluateBKM(BeforeEvaluateBKMEvent event) {
}
public void afterEvaluateBKM(AfterEvaluateBKMEvent event) {
}
public void beforeEvaluateContextEntry(BeforeEvaluateContextEntryEvent event) {
}
public void afterEvaluateContextEntry(AfterEvaluateContextEntryEvent event) {
}
public void beforeEvaluateDecisionTable(BeforeEvaluateDecisionTableEvent event) {
}
public void afterEvaluateDecisionTable(AfterEvaluateDecisionTableEvent event) {
}
public void beforeEvaluateDecisionService(BeforeEvaluateDecisionServiceEvent event) {
}
public void afterEvaluateDecisionService(AfterEvaluateDecisionServiceEvent event) {
}
}
```
The `PrometheusMetricsProvider` interface contains the required listeners for collecting Prometheus metrics. The interface is incorporated by the `kie-server-services-prometheus` dependency that you declared in your project `pom.xml` file.
In this example, the `ExampleCustomPrometheusMetricListener` class implements the `DMNRuntimeEventListener` listener (from the `PrometheusMetricsProvider` interface) and defines the custom DMN metrics to be collected and stored by Prometheus.
3. Implement the `PrometheusMetricsProvider` interface as part of a custom metrics provider class that associates your custom listener with the `PrometheusMetricsProvider` interface, as shown in the following example:
```java Sample implementation of the PrometheusMetricsProvider interface in a custom metrics provider class theme={null}
package org.kie.server.ext.prometheus;
import org.jbpm.executor.AsynchronousJobListener;
import org.jbpm.services.api.DeploymentEventListener;
import org.kie.api.event.rule.AgendaEventListener;
import org.kie.api.event.rule.DefaultAgendaEventListener;
import org.kie.dmn.api.core.event.DMNRuntimeEventListener;
import org.kie.server.services.api.KieContainerInstance;
import org.kie.server.services.prometheus.PrometheusMetricsProvider;
public class MyPrometheusMetricsProvider implements PrometheusMetricsProvider {
public DMNRuntimeEventListener createDMNRuntimeEventListener(KieContainerInstance kContainer) {
return new ExampleCustomPrometheusMetricListener(kContainer);
}
public AgendaEventListener createAgendaEventListener(String kieSessionId, KieContainerInstance kContainer) {
return new DefaultAgendaEventListener();
}
public PhaseLifecycleListener createPhaseLifecycleListener(String solverId) {
return new PhaseLifecycleListenerAdapter() {
};
}
public AsynchronousJobListener createAsynchronousJobListener() {
return null;
}
public DeploymentEventListener createDeploymentEventListener() {
return null;
}
}
```
In this example, the `MyPrometheusMetricsProvider` class implements the `PrometheusMetricsProvider` interface and includes your custom `ExampleCustomPrometheusMetricListener` listener class.
4. To make the new metrics provider discoverable for KIE Server, create a `META-INF/services/org.kie.server.services.prometheus.PrometheusMetricsProvider` file in your Maven project and add the fully qualified class name of the `PrometheusMetricsProvider` implementation class within the file. For this example, the file contains the single line `org.kie.server.ext.prometheus.MyPrometheusMetricsProvider`.
5. Build your project and copy the resulting JAR file into the `~/kie-server.war/WEB-INF/lib` directory of your project.
6. Start the KIE Server and deploy the built project to the running KIE Server. You can deploy the project using the Business Central interface or the KIE Server REST API (a `PUT` request to `http://SERVER:PORT/kie-server/services/rest/server/containers/{containerId}`).
After your project is deployed on a running KIE Server, Prometheus begins collecting metrics and KIE Server publishes the metrics to the REST API endpoint `http://HOST:PORT/SERVER/services/rest/metrics` (or on Spring Boot, to `http://HOST:PORT/rest/metrics`).