> ## Documentation Index
> Fetch the complete documentation index at: https://aletyx.ai/docs/llms.txt
> Use this file to discover all available pages before exploring further.
# Monitoring
> Review execution history, audit logs, and analytics for deployed models.
Review execution history, audit logs, and analytics for deployed models. All guides require Management access.
Monitoring has three screens, each in the left sidebar:
| Screen | Use it to… |
| -------------- | --------------------------------------------------------------------- |
| **Monitoring** | Browse and inspect individual model executions |
| **Audit Log** | See who changed what and when (configuration changes, not executions) |
| **Insights** | View aggregate metrics and trend charts |
## Executions
 **Executions vs. Execute Rules history**
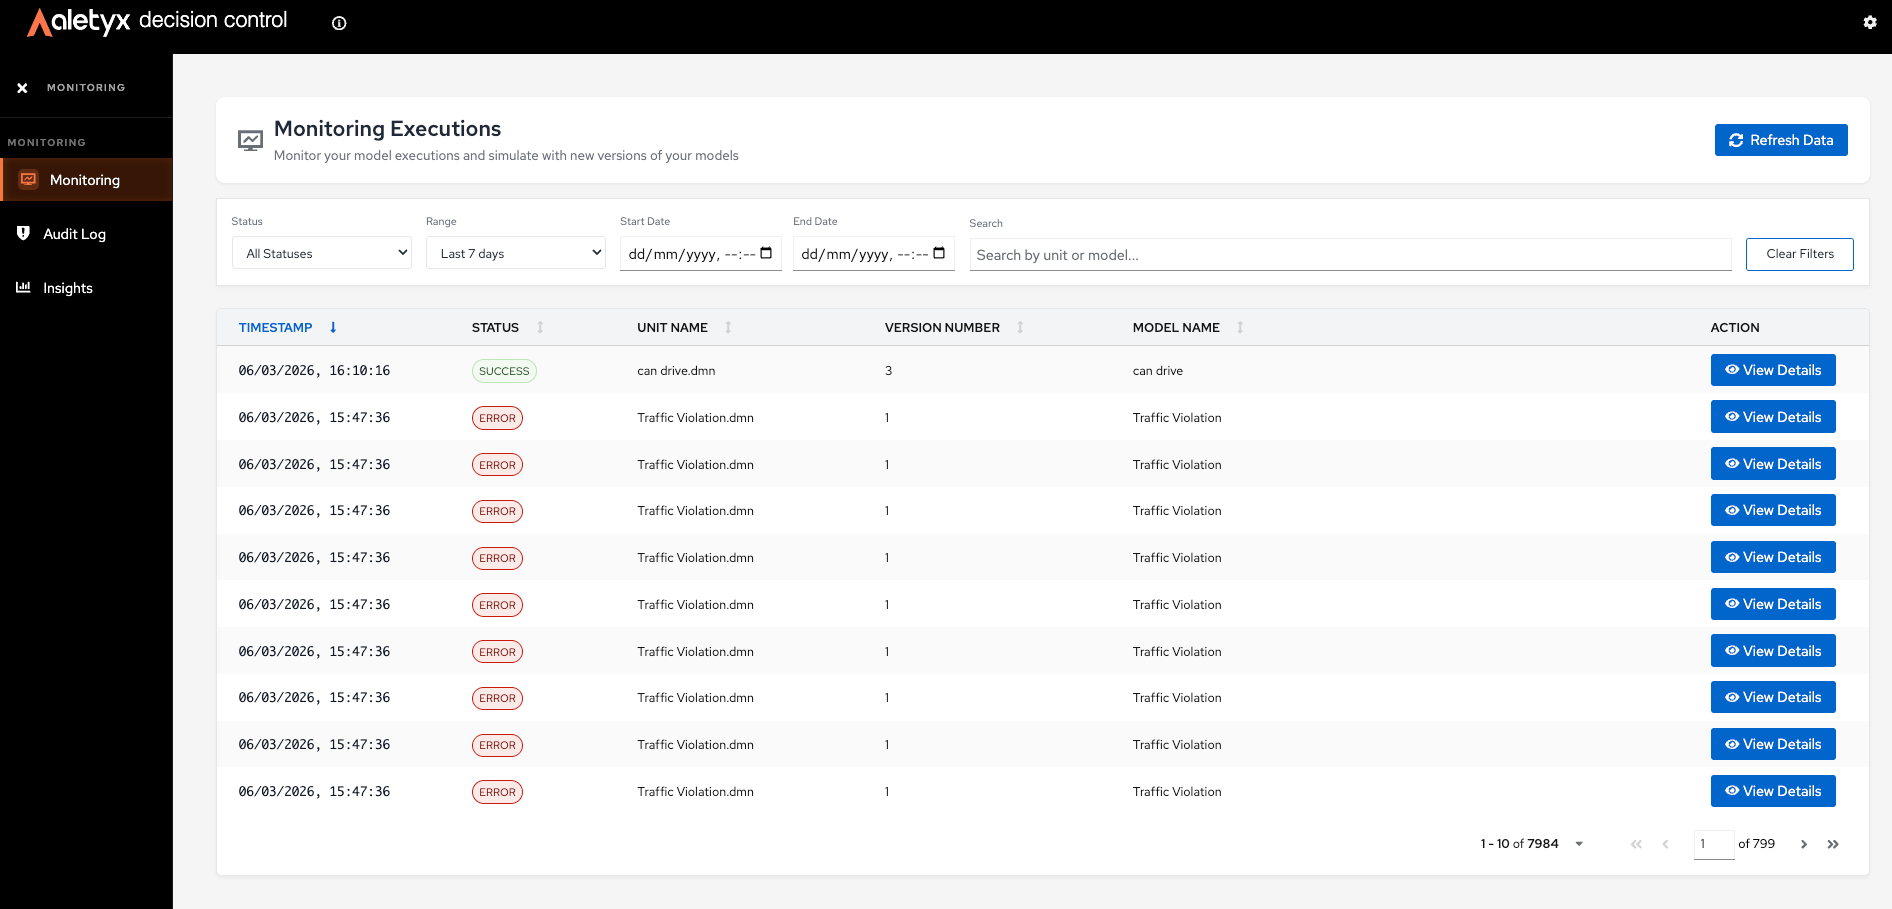
These are the **persisted** server-side execution records — they survive reloads and are visible to everyone with Management access. The History tab inside [Execute Rules](/docs/decision-control/how-to/management-execute#how-to-review-execution-history-in-execute-rules) is your local replay buffer for the current session.
### How to view and filter executions
Browse all model executions and narrow the list.
**Steps:**
1. Open **Monitoring → Monitoring** (executions list).
2. Use **Search by unit or model…**, the **Status** filter, and the **Range** (or custom **Start/End Date**) filter.
3. Sort via column headers; **Clear Filters** to reset; **Refresh Data** to reload.
**Verify:** The table shows matching executions with paging.
### How to view execution details
Inspect one execution's inputs, outputs, and metadata.
**Steps:**
1. In the executions list, click **View Details** (or the row).
2. Review the **Execution Detail** tab; switch input/output between **Form View** and **JSON**.
3. (Optional) Click the copy icon next to the execution ID to copy a shareable link to this execution.
**Verify:** The detail page shows the execution summary and I/O.
### How to run a simulation against another model version
Re-run a past execution's inputs against a different model version and compare — the fastest way to answer "would this case behave differently on the new version?"
**Prerequisites:** Viewing an execution detail.
**Steps:**
1. Open the **Simulator** tab.
2. Search/select a model version (by name, version, or hash).
3. Click **Run Simulation**.
4. Use the diff controls (**Show diff only**, search, theme) to compare outputs.
**Executions vs. Execute Rules history**
These are the **persisted** server-side execution records — they survive reloads and are visible to everyone with Management access. The History tab inside [Execute Rules](/docs/decision-control/how-to/management-execute#how-to-review-execution-history-in-execute-rules) is your local replay buffer for the current session.
### How to view and filter executions
Browse all model executions and narrow the list.
**Steps:**
1. Open **Monitoring → Monitoring** (executions list).
2. Use **Search by unit or model…**, the **Status** filter, and the **Range** (or custom **Start/End Date**) filter.
3. Sort via column headers; **Clear Filters** to reset; **Refresh Data** to reload.
**Verify:** The table shows matching executions with paging.
### How to view execution details
Inspect one execution's inputs, outputs, and metadata.
**Steps:**
1. In the executions list, click **View Details** (or the row).
2. Review the **Execution Detail** tab; switch input/output between **Form View** and **JSON**.
3. (Optional) Click the copy icon next to the execution ID to copy a shareable link to this execution.
**Verify:** The detail page shows the execution summary and I/O.
### How to run a simulation against another model version
Re-run a past execution's inputs against a different model version and compare — the fastest way to answer "would this case behave differently on the new version?"
**Prerequisites:** Viewing an execution detail.
**Steps:**
1. Open the **Simulator** tab.
2. Search/select a model version (by name, version, or hash).
3. Click **Run Simulation**.
4. Use the diff controls (**Show diff only**, search, theme) to compare outputs.
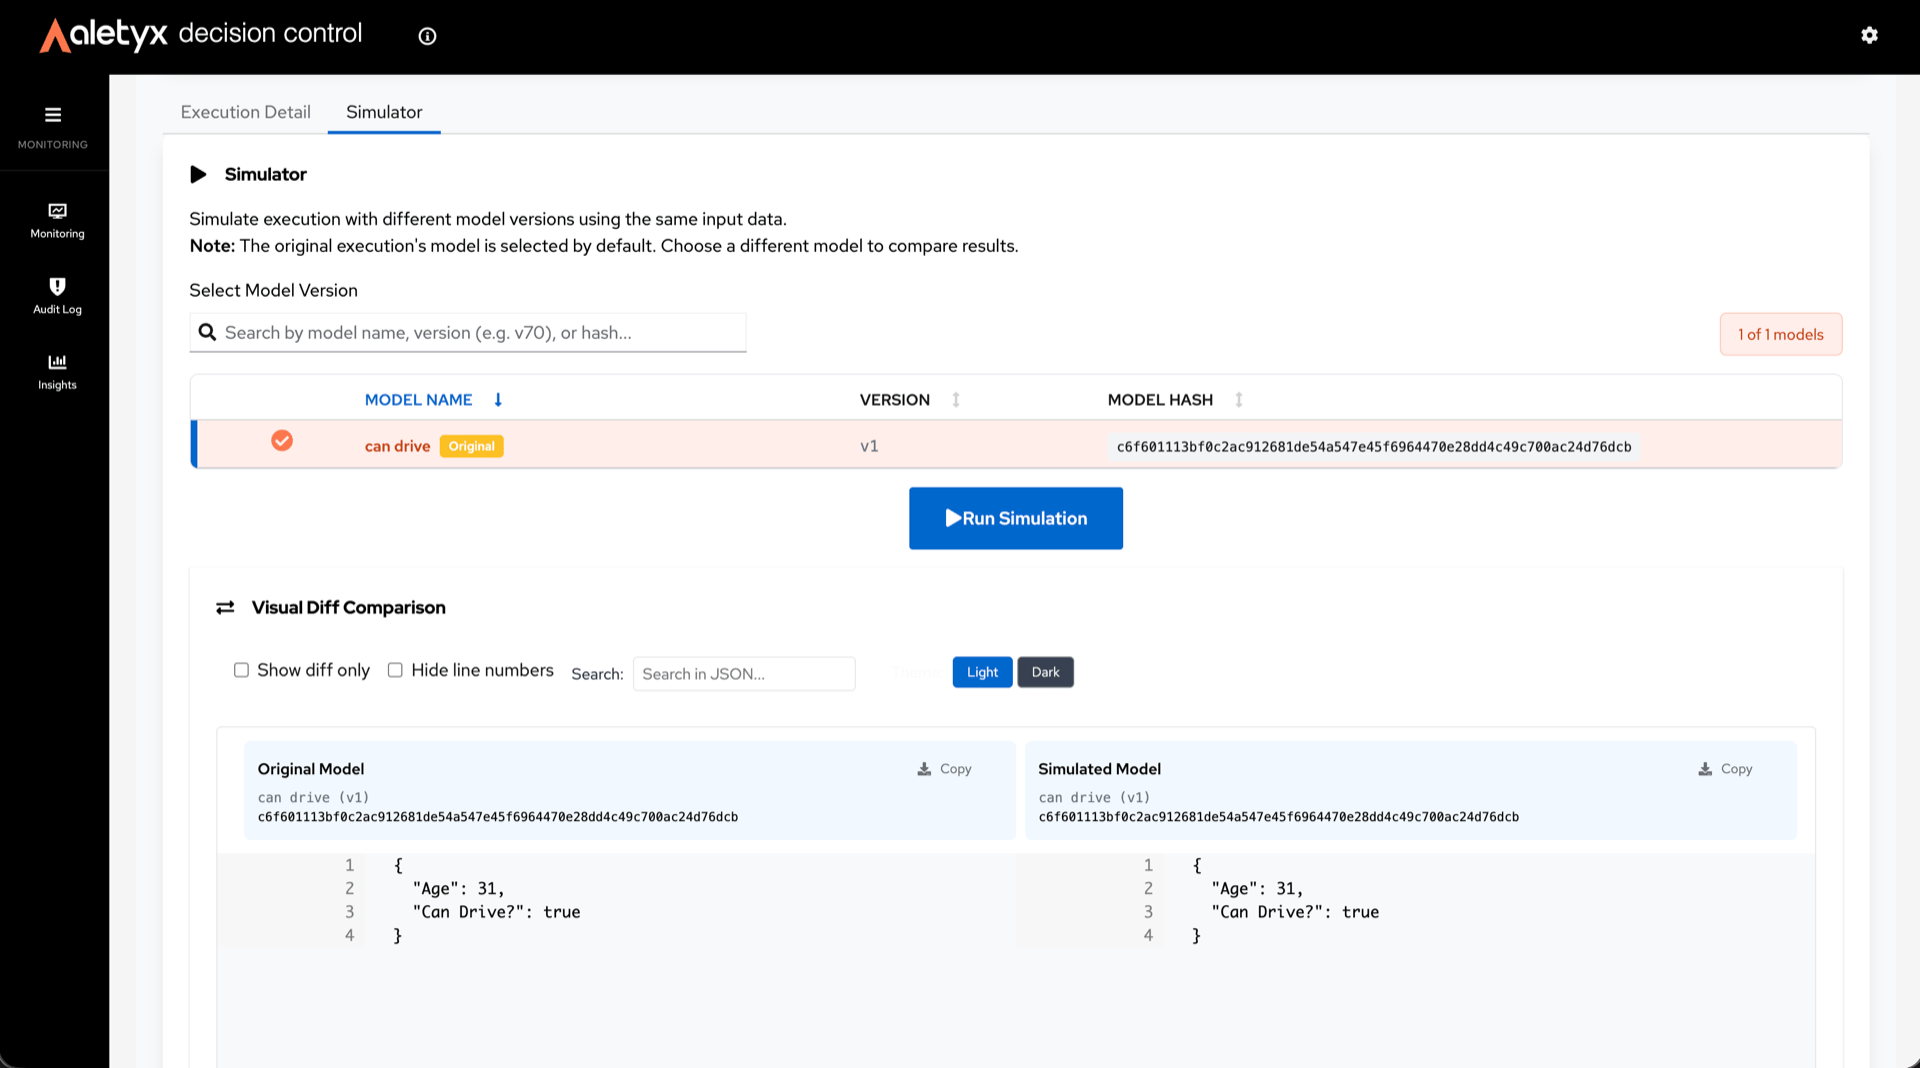 **Verify:** A visual diff comparison renders original vs. simulated output.
## Audit Log
**Verify:** A visual diff comparison renders original vs. simulated output.
## Audit Log
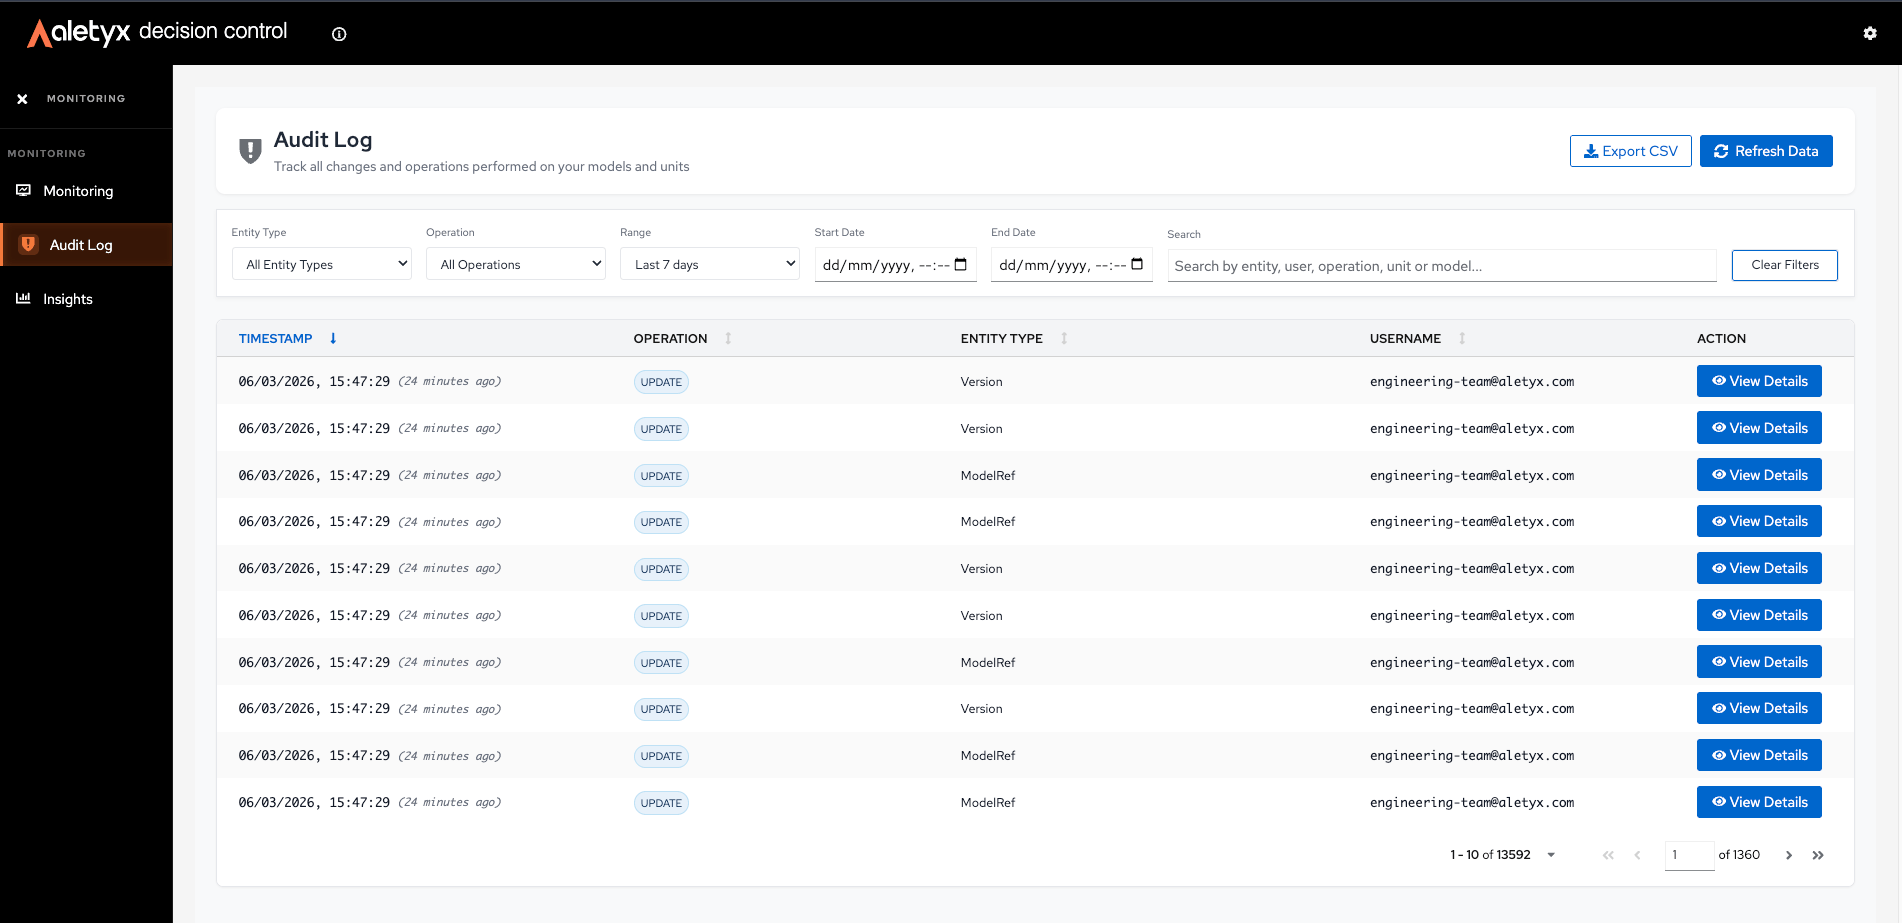 The audit log captures **configuration changes** — uploads, enable/disable toggles, deletes, description edits. Every row tells you who did what, to which entity, when.
| Operation | Means |
| ---------- | ----------------------------------------------------------------- |
| **INSERT** | An entity was created (e.g., a model uploaded) |
| **UPDATE** | An entity was modified (e.g., description edited, status toggled) |
| **DELETE** | An entity was removed |
### How to view and filter the audit log
**Steps:**
1. Open **Monitoring → Audit Log**.
2. Use **Search…**, **Entity Type**, **Operation** (INSERT/UPDATE/DELETE), and **Range**/custom dates.
3. Sort columns; **Clear Filters** to reset.
4. Click **View Details** on a row for the full entry.
**Verify:** The table filters accordingly and the details modal opens.
### How to export the audit log to CSV
Download audit entries for offline review.
**Prerequisites:** At least one audit entry (the button is disabled otherwise).
**Steps:**
1. On **Audit Log**, apply any filters you want.
2. Click **Export CSV**.
**Verify:** A CSV file downloads containing the audit entries.
## Insights
Insights has four views you switch between with tabs at the top:
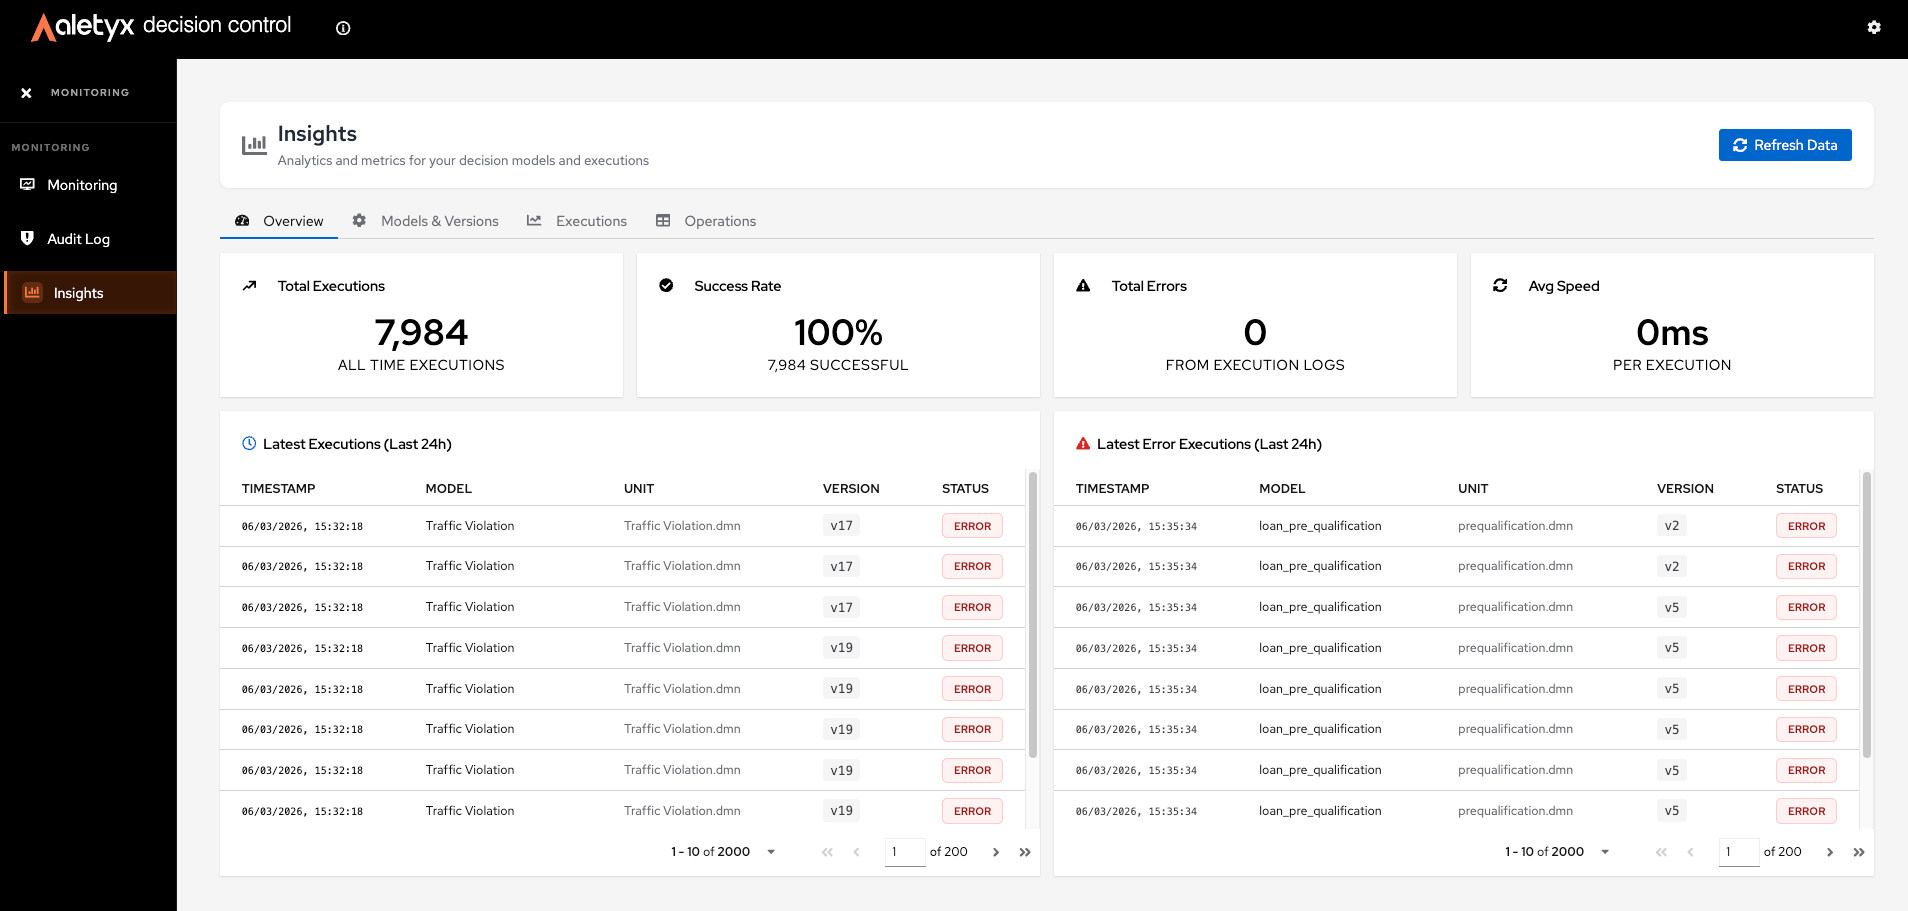
Big-picture metric cards and the most recent activity at a glance.
The audit log captures **configuration changes** — uploads, enable/disable toggles, deletes, description edits. Every row tells you who did what, to which entity, when.
| Operation | Means |
| ---------- | ----------------------------------------------------------------- |
| **INSERT** | An entity was created (e.g., a model uploaded) |
| **UPDATE** | An entity was modified (e.g., description edited, status toggled) |
| **DELETE** | An entity was removed |
### How to view and filter the audit log
**Steps:**
1. Open **Monitoring → Audit Log**.
2. Use **Search…**, **Entity Type**, **Operation** (INSERT/UPDATE/DELETE), and **Range**/custom dates.
3. Sort columns; **Clear Filters** to reset.
4. Click **View Details** on a row for the full entry.
**Verify:** The table filters accordingly and the details modal opens.
### How to export the audit log to CSV
Download audit entries for offline review.
**Prerequisites:** At least one audit entry (the button is disabled otherwise).
**Steps:**
1. On **Audit Log**, apply any filters you want.
2. Click **Export CSV**.
**Verify:** A CSV file downloads containing the audit entries.
## Insights
Insights has four views you switch between with tabs at the top:
Big-picture metric cards and the most recent activity at a glance.
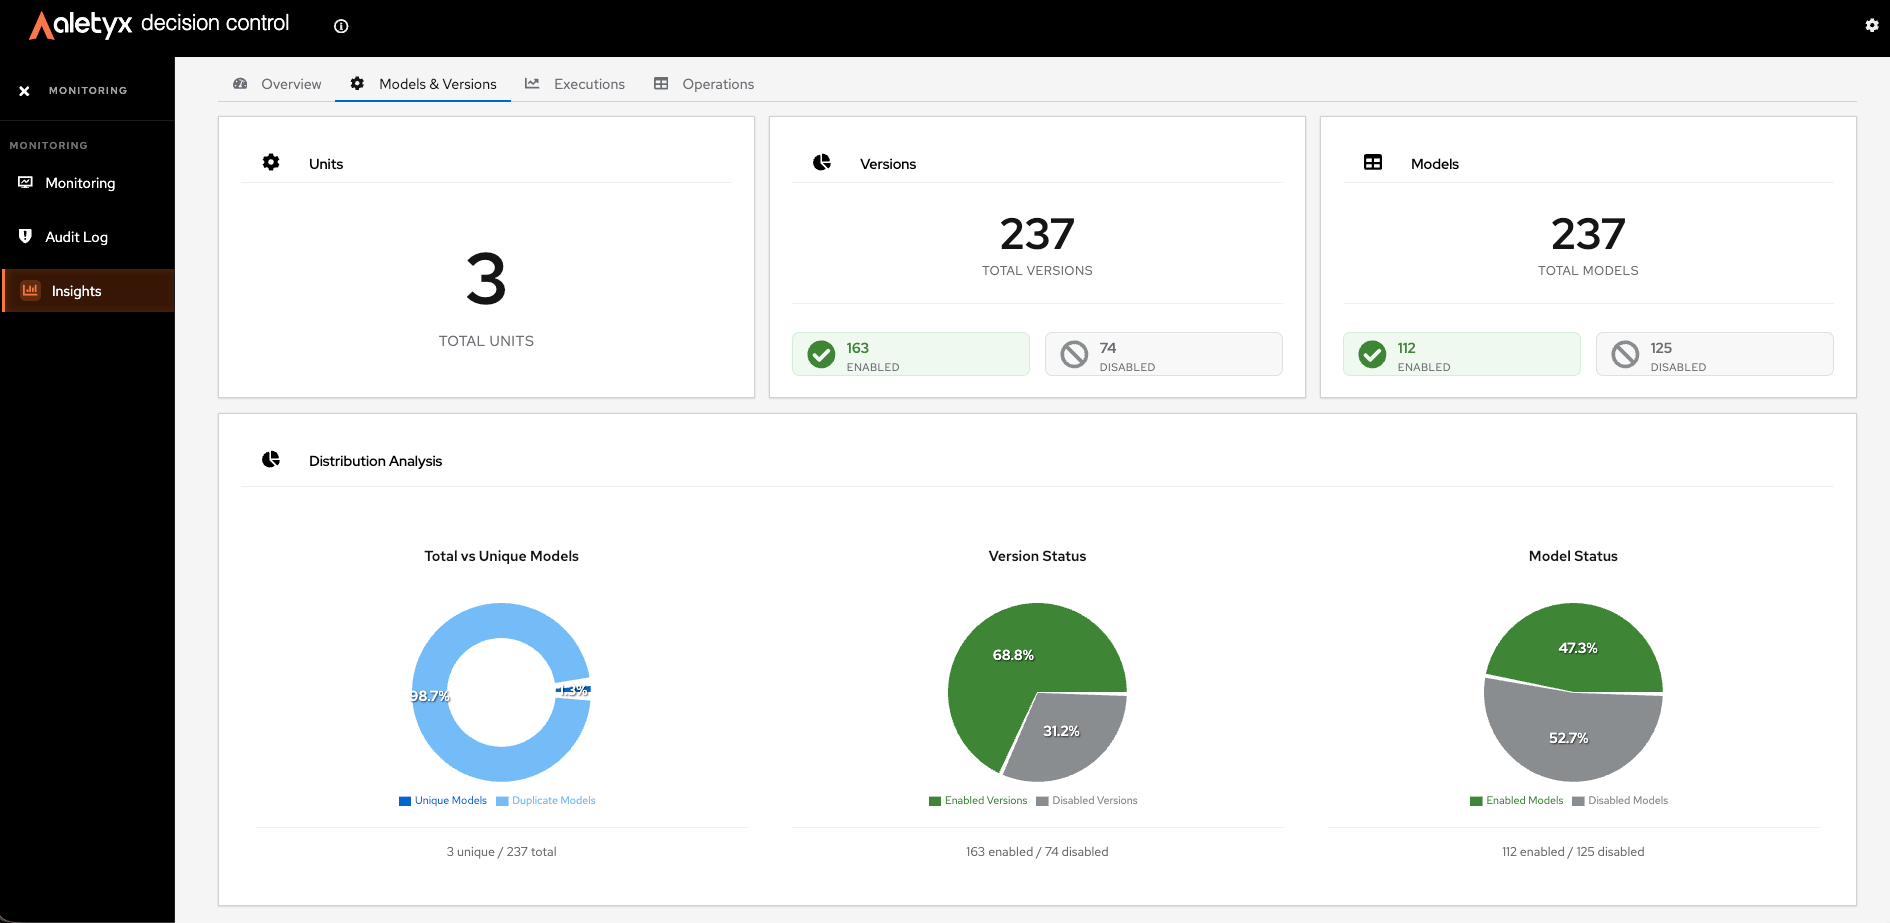
 Per-model and per-version statistics — useful to spot a version that's getting hit (or failing) more than expected.
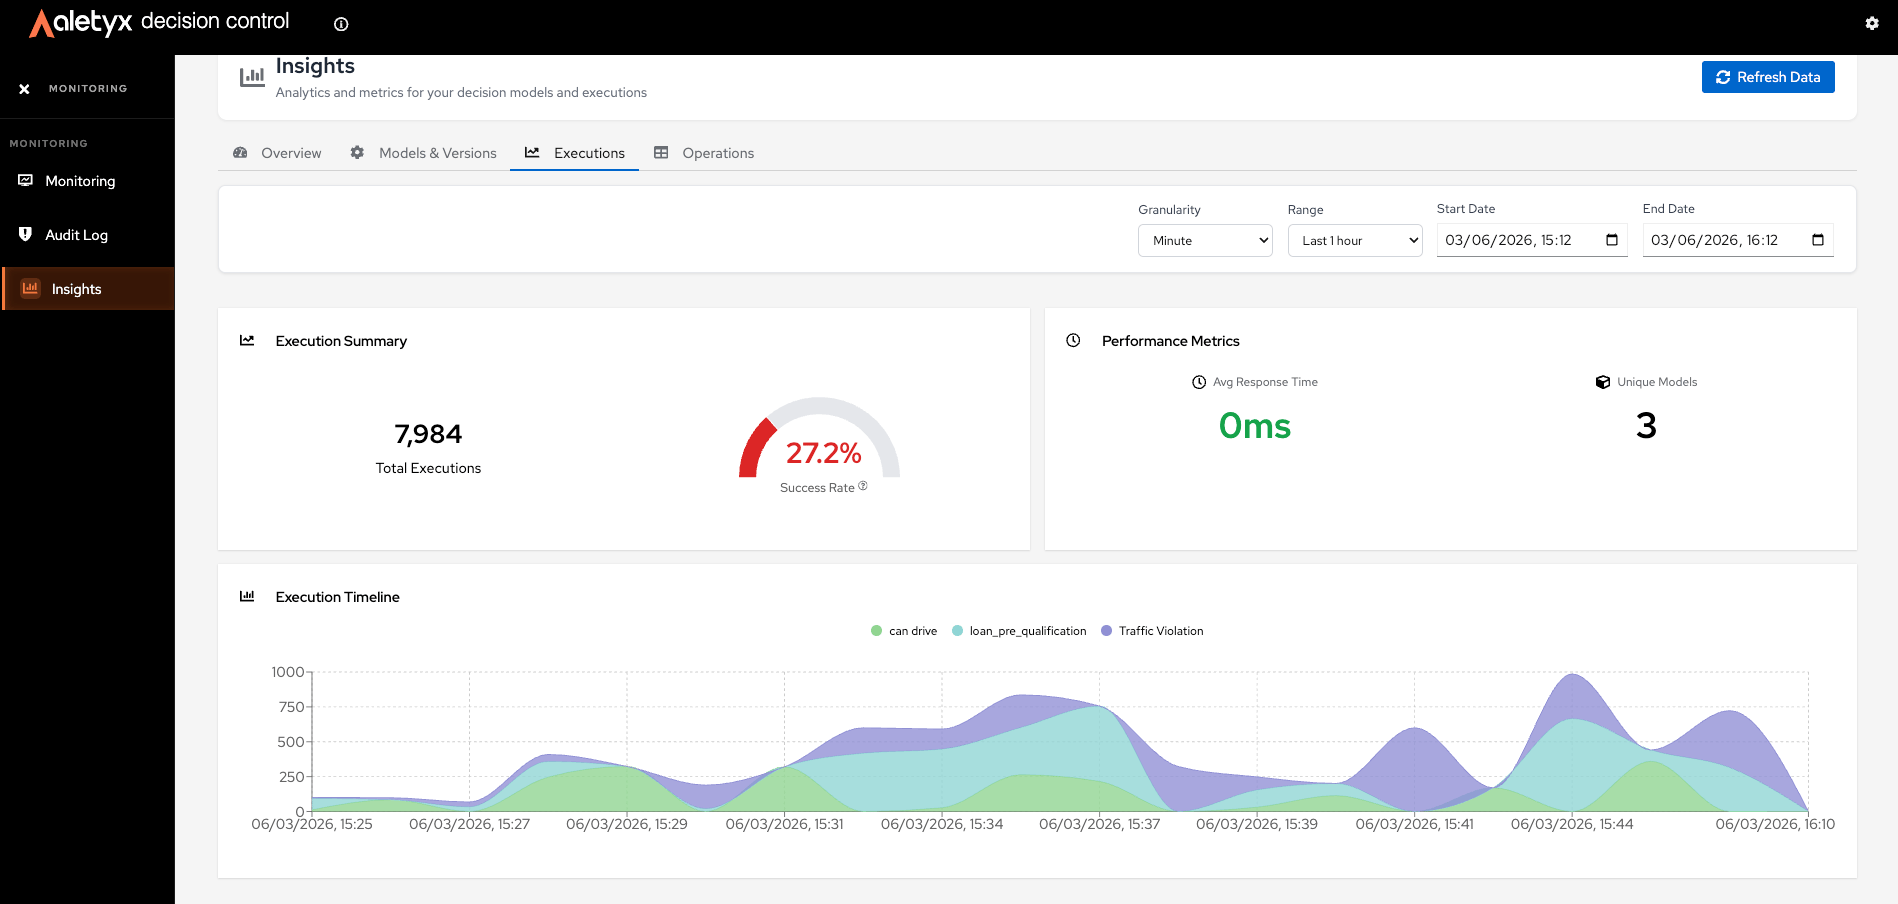
 Trend charts over time. Adjust **Range** and **Granularity** to zoom from "last hour" to "last quarter".
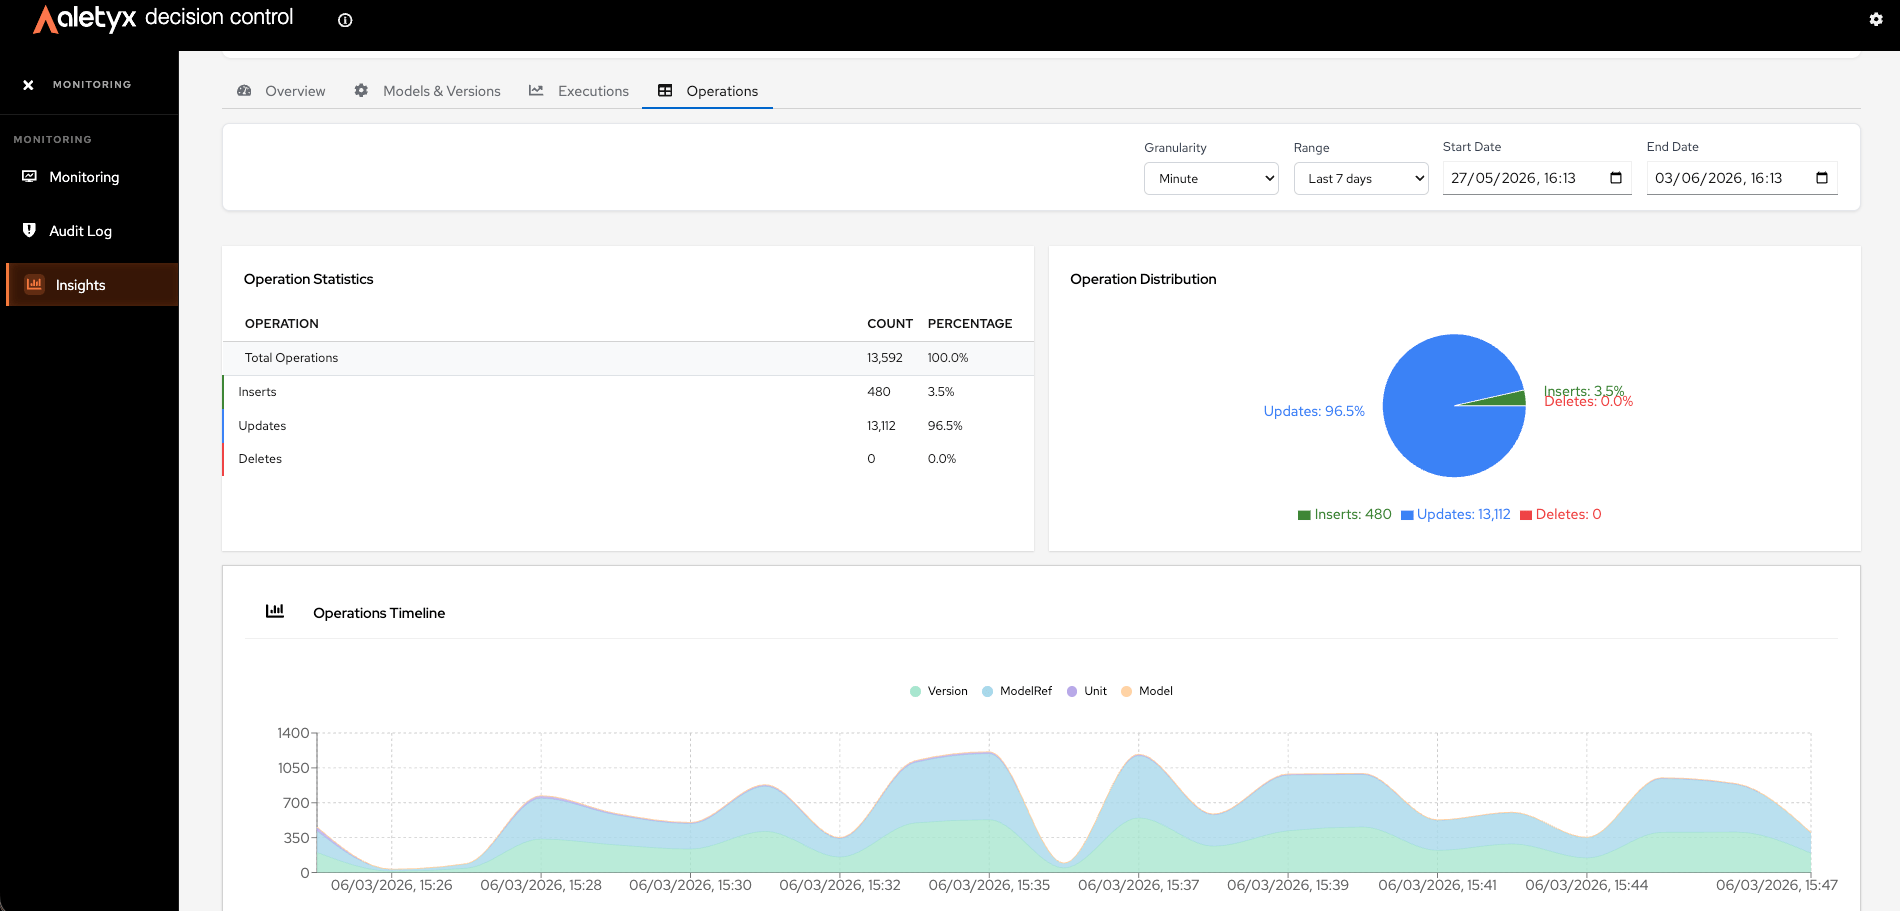
 Audit operation counts — how many **INSERT** / **UPDATE** / **DELETE** operations happened, broken down by entity type.
 ### How to view insights and analytics
**Steps:**
1. Open **Monitoring → Insights**.
2. Pick the tab you need (see above).
3. Click **Refresh Data** to reload.
**Verify:** Cards and charts render with current data.
### How to view insights and analytics
**Steps:**
1. Open **Monitoring → Insights**.
2. Pick the tab you need (see above).
3. Click **Refresh Data** to reload.
**Verify:** Cards and charts render with current data.